<?xml version="1.0" encoding="utf-8"?><feed xmlns="http://www.w3.org/2005/Atom" ><generator uri="https://jekyllrb.com/" version="4.2.2">Jekyll</generator><link href="https://blog.showipintbri.com/feed.xml" rel="self" type="application/atom+xml" /><link href="https://blog.showipintbri.com/" rel="alternate" type="text/html" /><updated>2022-06-19T13:35:23-05:00</updated><id>https://blog.showipintbri.com/feed.xml</id><title type="html">Failing Forward</title><subtitle>Tony E&apos;s Journey through Tech and Life.</subtitle><entry><title type="html">Where To Start Capturing Packets</title><link href="https://blog.showipintbri.com/blog/where-to-start" rel="alternate" type="text/html" title="Where To Start Capturing Packets" /><published>2022-06-05T00:00:00-05:00</published><updated>2022-06-05T00:00:00-05:00</updated><id>https://blog.showipintbri.com/blog/where-to-start</id><content type="html" xml:base="https://blog.showipintbri.com/blog/where-to-start"><![CDATA[<p>Whether you’re a network engineer or security analyst at some point you’re going to need to dive into the packets to help solve a problem.</p>

<p><strong>Story Time:</strong><br />
Shortly after I earned my CCIE I was faced with a packet analysis challenge. I was on-site visiting with some team mates who managed a customer’s network. A user at a site was complaining: “<strong>the network is slow</strong>”. My team has been working with this site for a few days checking all the routing and devices in the network path, testing traffic from all the network devices and more. The user was still having issues and sent a packet capture from their workstation to my team. I started shoulder-surfing as soon as I saw Wireshark open on their desktop. They were hoping their freshly minted CCIE coworker could quickly help them out. The problem was, <strong>I had no idea what I was looking at</strong>. There I was, the most certified person in the room, and no idea how to begin to properly analyze this packet capture to help narrow down where or what may be causing network performance issues. This was embarrassing for me. I wanted to make sure that anytime someone gave me a packet capture to analyze that I had a strategy, and an understanding of what something <em>should</em> look like under optimal conditions. This started my packet analysis journey.
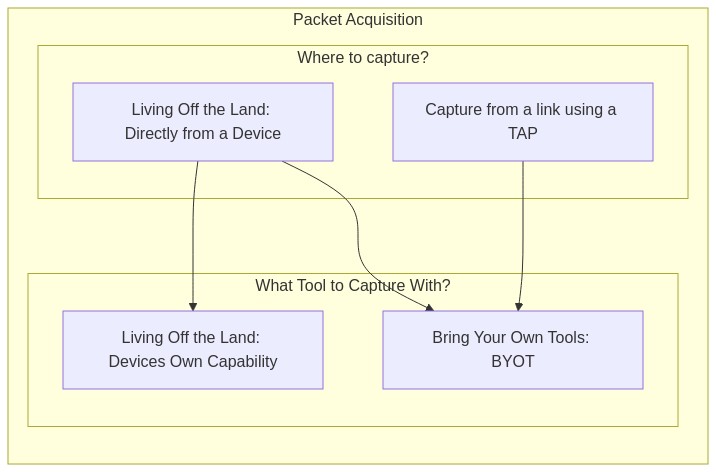
</p>

<h1 id="packet-acquisition">Packet Acquisition</h1>
<p>“Packet Acquisition” is the process and/or tooling used to acquire the packets or ‘actually capturing them’. There are countless blogs and articles about the TAP vs. SPAN arguments. This is not that.</p>

<p>Before you can acquire the packets you should answer 2 basic questions:</p>

<ol>
  <li>Where to capture from?  <br />
    <ul>
      <li>From a link using a TAP</li>
      <li>Directly from a device</li>
    </ul>
  </li>
  <li>What tool to capture with?  <br />
    <ul>
      <li>The devices own capture capability</li>
      <li>B.Y.O.T. (Bring Your Own Tools)</li>
    </ul>
  </li>
</ol>

<p><img src="https://mermaid.ink/img/pako:eNqVUUFuwjAQ_MrKZ_hAKrVKSG9IoDYSQnEPxt4Qi8SmzhpEEX-vnZSqQfTAnnY8s-NZ-8ykVcgStnViX8P8jRsI1fnNcPCFzpacLYXcIUEqP73uNGlrOPsYpCO5NRjUqxodAlmQYk_e4ctIHEtphzLaQJGNmbScDUNQOduCgEabHfhOm20ARbq8ccrKuT5EclFVQDXCXBiVQN5f0JyuLjketMQ_s2jUnfx0tH1-QVBY28QdrnFWmupHFpn9E6wP0sHiaKK12OhG0-nGNS8zF0fX1rteGcN0CWTrRXFvh98mhen0GfKnAWU9mo1Q5LhhE9aia4VW4evPkecsZGyRsyS0CivhG-KMm0uQ-r0ShK9Kk3UsqUTT4YQJT_b9ZCRLyHm8inItwku2P6rLN6Ket-I" alt="" /></p>

<h2 id="where-to-capture">Where to Capture</h2>
<p>In order to know “<em>where is the best place to capture traffic</em>” you’ll need to understand what it is you’re looking for and where that traffic flows. It wouldn’t do you any good to capture from a device or a link that your traffic doesn’t pass through. Sometimes, the <em>best place</em> isn’t an option for you, so you’ll also need to be prepared to capture from a less than ideal alternative location while still gathering the data you need to perform analysis or prove your hypothesis.</p>

<p><strong>NOTE:</strong> This blog post makes some assumptions about your work experience, knowledge and understanding of networks and network traffic.</p>

<p>The answer to: “<em>Where is the best place to capture traffic?</em>” is relative, as different places throughout the network can give different vantage points. Regardless, if it is the <em>best</em> place or not, your choices will fall into 1 of two categories:</p>

<ul>
  <li>Strategic placement of a TAP or visibility sensor</li>
  <li>Living off the Land (LoL)</li>
</ul>

<h3 id="strategic-tapsensor-placement">Strategic TAP/Sensor Placement</h3>
<p>Placing a TAP or a sensor exactly where you want in the network is the most ideal situation.</p>

<p><strong>Examples of strategic TAP/Sensor placement:</strong></p>

<ul>
  <li>In front of a server where all users are experiencing delays.</li>
  <li>In front of a printer that frequently is ‘unreachable’.</li>
  <li>South of a FW to have visibility into East-West traffic.</li>
  <li>Between a FW and Router to have visibility on all the North-South traffic.</li>
</ul>

<p>Using a network TAP/visibility sensor is optimal because it provides the true view with the true delay of exactly what is on the wire. This method is absent of other computationally expensive processes that can occur when you have to Live off the Land. This is especially important when diagnosing issues related to delay and timing. Many high end servers have specialized NICs with additional features or functions designed to ‘lighten the load’ on the processor. This can be a disadvantage when capturing directly from a device and trying to get the ‘true view’ of the packets in flight. For this reason capturing from a link with a TAP in-line is a superior choice.</p>

<h3 id="living-off-the-land">Living off the Land</h3>
<p>“Living off the land” is a phrase meaning: using a devices built-in capture capability without any additional tooling.</p>

<p>In a typical enterprise network there are networking components like: routers, switches, firewalls and more. There are also end-points and workstations. Most of these devices have some packet capturing capabilities built in. Capturing from each of these devices is a little different and can yield slightly different packet captures, each with their own view of the traffic, which can result in <strong><em>multiple-truths</em></strong>. As a network engineer or security analyst, it’s your job to understand the concept of multiple-truths and apply that to your analysis of the packet captures.</p>

<p><strong>Multiple-Truths:</strong></p>

<p><img src="/assets/images/this-is-truth.jpg" alt="This is Truth" /></p>

<p>
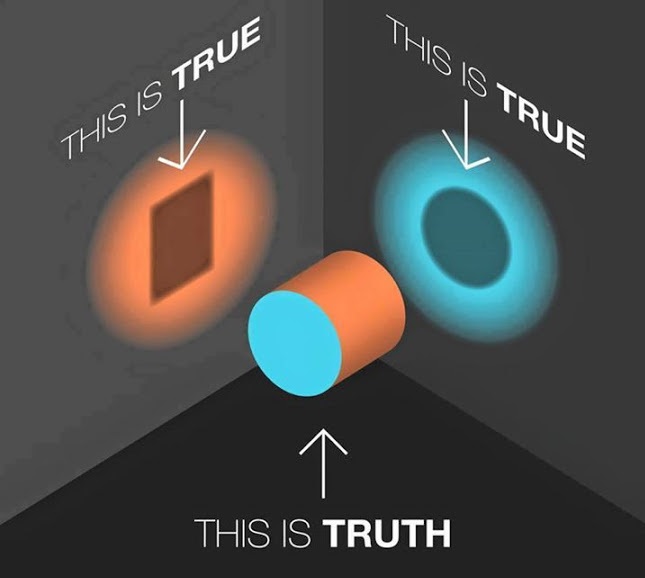
I love this image. I use it all the time. Multiple things can be true regarding a single issue and it’s only a matter of perspective.</p>

<p><strong>Examples of Living off the Land:</strong></p>

<ul>
  <li>Using the packet capture capability of the router</li>
  <li>Leveraging the SPAN/Mirror port of a switched infrastructure</li>
  <li>Using tcpdump/wireshark directly on the end-host/server</li>
</ul>

<p>Ultimately deciding “where to capture” becomes a logic exercise between what you want to see and where you can see it from. The bottom line is:</p>

<blockquote>
  <p>Having /a/ PCAP is better than no PCAP!</p>
</blockquote>

<h2 id="what-to-capture-with">What to Capture With?</h2>
<p>Depending on whether you are strategically placing a TAP/sensor or Living off the Land, might pre-determine the tools you use to capture the packets. For example, if your capture point is a Cisco router, you might be limited to using Cisco’s Embedded Packet Capture. On the other hand if you are placing a TAP between 2 devices and capturing using a fully featured operating system, you’ll likely have many tools available to you.</p>

<h3 id="living-off-the-land-routers">Living Off the Land: Routers</h3>
<p>Most routers have some way to capture packets for diagnostics. Generally speaking this is not suitable for long-term captures because of the potential performance degradation. This should be used for short-term troubleshooting only.</p>

<ul>
  <li><a href="https://www.cisco.com/c/en/us/support/docs/ios-nx-os-software/ios-embedded-packet-capture/116045-productconfig-epc-00.html">Cisco’s Embedded Packet Capture (EPC)</a></li>
  <li><a href="https://www.juniper.net/documentation/us/en/software/junos/network-mgmt/topics/topic-map/analyze-network-traffic-by-using-packet-capture.html">Juniper</a></li>
  <li><a href="https://openwrt.org/docs/guide-user/firewall/misc/tcpdump_wireshark">OpenWRT</a></li>
  <li><a href="https://docs.vyos.io/en/latest/troubleshooting/index.html#traffic-dumps">VyOS</a></li>
  <li><a href="https://docs.netgate.com/pfsense/en/latest/diagnostics/packetcapture/index.html">pfsense</a></li>
</ul>

<p><strong>Warning:</strong> Routers are typically built for high-speed data-plane packet transfers. When capturing from a router you are pulling packets out of the high-speed data path and pushing them through the lower speed (lower resourced) control plane/management plane.</p>

<h3 id="living-off-the-land-firewalls">Living Off the Land: Firewalls</h3>
<p>Similar to routers, most if not all, firewalls have a built-in packet capture capability. Some can even mirror traffic from one port to another. Again, this type of capture should be used for specific troubleshooting use cases and is not suitable for long term packet captures.</p>

<p><strong>Note:</strong> If using Palo-Alto Firewalls and using tcpdump from the cli, by default it will only capture on the MGMT interface, not the data plane interfaces. Ask me how I know :D</p>

<h3 id="living-off-the-land-switches">Living Off the Land: Switches</h3>
<p>SPAN ports, SPAN ports, SPAN ports.</p>

<p>To be clear, a SPAN port isn’t a tool to capture the packets, instead its part of the plumbing in the switch that duplicates the packets out an interface so you can capture them. Again, I won’t rehash the age old discussion of TAP vs. SPAN but if a SPAN is all you have, it’ll have to do. I am a fan of the SPAN. (&lt;–I’m going to put that on a t-shirt) There are some cool things you can do with a SPAN port from a switch such as capturing an entire VLAN. This isn’t without it’s caveats, you can severely impact the performance of older switches, and you can over-subscribe the interface transmitting to your capture device. Also, incoming malformed frames aren’t duplicated but dropped on ingress to the switch. (&lt;–If this was your issue you’d probably want to be able to see it). There was a really good article on <a href="https://packetpushers.net/why-your-on-switch-packet-capture-doesnt-work/">packet-pushers blog about capturing from a switch</a> that I think should be a must read.</p>

<p>There are lots of options when using a SPAN/mirror port and they differ from Vendor, model and software version.</p>

<p><strong>WARNING:</strong> Over-subscription is your enemy when it comes to SPAN ports.</p>

<h4 id="span-port-references">SPAN Port References</h4>
<ul>
  <li><a href="https://www.cisco.com/c/en/us/td/docs/switches/lan/catalyst2960l/software/15-2_5_e/config-guide/b_1525e_consolidated_2960l_cg/b_1525e_consolidated_2960l_cg_chapter_011001.html"><strong>Cisco:</strong></a>
    <div class="language-plaintext highlighter-rouge"><div class="highlight"><pre class="highlight"><code>no monitor session 1
default interface gi0/2

monitor session 1 source interface gi0/1
monitor session 1 destination interface gi0/2 
</code></pre></div>    </div>
  </li>
  <li><a href="https://www.juniper.net/documentation/en_US/junos/topics/example/port-mirroring-local-ex-series.html"><strong>Juniper:</strong></a>
    <div class="language-plaintext highlighter-rouge"><div class="highlight"><pre class="highlight"><code>set interfaces ge-0/0/47 description "SPAN-PORT for Testing"
set interfaces ge-0/0/47 unit 0 family ethernet-switching

set forwarding-options analyzer SPAN_NAME input ingress vlan 10
set forwarding-options analyzer SPAN_NAME output interface ge-0/0/47.0
</code></pre></div>    </div>
  </li>
</ul>

<h3 id="byot-bring-your-own-tools">B.Y.O.T. (Bring Your Own Tools)</h3>
<p>If you are capturing from a TAP, visibility sensor or directly from an end-point device like a workstation you’ll have the option of choosing the best tool for the job. You should choose the tool that has the features you need and runs efficiently on the system you’re using. Depending on your environment you might be in a situation where there’s only one tool available, like a linux environment without internet access to get new packages. In this case most linux distro’s include tcpdump. Some of the most common packet capture software are:</p>

<table>
  <thead>
    <tr>
      <th>Tool Name</th>
      <th>OS</th>
      <th>File Format</th>
      <th style="text-align: center">Capturing</th>
      <th style="text-align: center">Filtering</th>
      <th style="text-align: center">Reading</th>
    </tr>
  </thead>
  <tbody>
    <tr>
      <td><a href="https://www.tcpdump.org/manpages/">tcpdump</a></td>
      <td>Linux</td>
      <td>PCAP</td>
      <td style="text-align: center">Y</td>
      <td style="text-align: center">Y</td>
      <td style="text-align: center">Y</td>
    </tr>
    <tr>
      <td><a href="https://www.wireshark.org/docs/man-pages/dumpcap.html">dumpcap</a></td>
      <td>windows, *nix &amp; mac</td>
      <td>PCAPng</td>
      <td style="text-align: center">Y</td>
      <td style="text-align: center">Y</td>
      <td style="text-align: center">N</td>
    </tr>
    <tr>
      <td><a href="https://www.wireshark.org/docs/man-pages/tshark.html">tshark</a></td>
      <td>windows, *nix &amp; mac</td>
      <td>PCAPng</td>
      <td style="text-align: center">Y</td>
      <td style="text-align: center">Y</td>
      <td style="text-align: center">Y</td>
    </tr>
    <tr>
      <td><a href="">Wireshark</a></td>
      <td>windows, *nix &amp; mac</td>
      <td>Many</td>
      <td style="text-align: center">Y</td>
      <td style="text-align: center">Y</td>
      <td style="text-align: center">Y</td>
    </tr>
  </tbody>
</table>

<h4 id="basic-usage">Basic Usage</h4>
<p><strong>tcpdump:</strong> tcpdump is very fast and uses bpf syntax for filters. The most simplest usage example is:</p>
<div class="language-plaintext highlighter-rouge"><div class="highlight"><pre class="highlight"><code># Dump packet summary to stdout
tcpdump -i [interface_name]

# Write packets to PCAP file
tcpdump -i [interface_name] -w [filename.pcap]
</code></pre></div></div>
<p><br />
<br />
<strong>dumpcap:</strong> This is the capture utility the Wireshark GUI uses when you’re capturing from an interface. A simple usage example:</p>
<div class="language-plaintext highlighter-rouge"><div class="highlight"><pre class="highlight"><code># Write packets to PCAPng file
dumpcap -i [interface_name] -w [filename.pcapng]
</code></pre></div></div>
<p><br />
<br />
<strong>tshark:</strong> This is the reading and filtering engine Wireshark GUI uses. This is a command line utility. A simple usage example is:</p>
<div class="language-plaintext highlighter-rouge"><div class="highlight"><pre class="highlight"><code># Dump packet summary to stdout
tshark -i [interface_name]

# Write packets to PCAPng file
tshark -i [interface_name] -w [filename.pcapng]
</code></pre></div></div>
<p><br />
<br />
<strong>Wireshark:</strong> The GUI application can be invoked via CLI as well:</p>
<div class="language-plaintext highlighter-rouge"><div class="highlight"><pre class="highlight"><code># Write packets to PCAPng file
wireshark -i [interface_name] -w [filename.pcapng]
</code></pre></div></div>
<p><br />
<br />
<strong>Pro-tip:</strong> Become fluent in the 3-above examples. You might be in a situation where its the only tool available and you have to make it work.</p>

<h1 id="final-thoughts">Final Thoughts</h1>
<p>Like networking skills, your packet analysis skills will mature. The more you do it, the more you’ll learn. First you get familiar with the tools, then the process, then the analysis. Eventually, you’ll become syntacticly fluent in multiple tools, able to get packets out of any environment and analyze traffic from unknown network topologies, quickly.</p>

<p><strong>Remember:</strong> Packet Acquisition is step #1 to Packet Analysis.</p>

<p><strong>Moment of Truth:</strong> I’ve tried to describe all of the above in a very scientific and methodical way that will yield positive results. Sometimes scientific methods can take the fun out of it. How about you just start capturing with what ever you have and see what you get. Have fun! I know I will :D</p>

<p><strong>Remember:</strong> If women don’t find you handsome, they should at least find you handy.</p>]]></content><author><name></name></author><category term="pcap" /><category term="Wireshark" /><category term="tcpdump" /><summary type="html"><![CDATA[If you want to start capturing packets but aren't sure where to start, this blog will walk you through the first 2 decisions you need to make.]]></summary></entry><entry><title type="html">Docker on WSL2</title><link href="https://blog.showipintbri.com/blog/docker-wsl2" rel="alternate" type="text/html" title="Docker on WSL2" /><published>2022-03-01T00:00:00-06:00</published><updated>2022-03-01T00:00:00-06:00</updated><id>https://blog.showipintbri.com/blog/docker-wsl2</id><content type="html" xml:base="https://blog.showipintbri.com/blog/docker-wsl2"><![CDATA[<p>For a project I was doing (building a custom VyOS ISO) I wanted to try running a container using Docker in my WSL environment on my laptop. I was told this works and read many examples on how to achieve this.</p>

<p>While, I do fancy myself as someone who pays close attention to detail, this time I was bested.</p>

<p>I followed many guides to get docker running in WSL.</p>

<p>I’m really loving having native linux on my Windows 10 laptop. There’s a small learning curve when needing to troubleshoot if things go wrong.</p>

<p>Not being a docker expert myself or experienced with Windows Sub-system for Linux (WSL), I was following someone else’s guide. No where was it mentioned about the different versions of WSL or any problems that could cause.</p>

<p><strong>Exhibit: A</strong></p>

<p><a href="https://dev.to/felipecrs/simply-run-docker-on-wsl2-3o8">https://dev.to/felipecrs/simply-run-docker-on-wsl2-3o8</a></p>

<div class="language-bash highlighter-rouge"><div class="highlight"><pre class="highlight"><code><span class="c"># Ensures not older packages are installed:</span>
<span class="nb">sudo </span>apt-get remove docker docker-engine docker.io containerd runc

<span class="nb">sudo </span>apt-get update

<span class="c"># Ensure pre-requisites are installed:</span>
<span class="nb">sudo </span>apt-get <span class="nb">install</span> <span class="se">\</span>
    apt-transport-https <span class="se">\</span>
    ca-certificates <span class="se">\</span>
    curl <span class="se">\</span>
    gnupg <span class="se">\</span>
    lsb-release

<span class="c"># Adds docker apt repository:</span>
<span class="nb">echo</span> <span class="se">\</span>
    <span class="s2">"deb [arch=</span><span class="si">$(</span>dpkg <span class="nt">--print-architecture</span><span class="si">)</span><span class="s2"> signed-by=/usr/share/keyrings/docker-archive-keyring.gpg] https://download.docker.com/linux/ubuntu </span><span class="si">$(</span>lsb_release <span class="nt">-cs</span><span class="si">)</span><span class="s2"> stable"</span> |
    <span class="nb">sudo tee</span> /etc/apt/sources.list.d/docker.list <span class="o">&gt;</span> /dev/null

<span class="c"># Adds docker apt key:</span>
curl <span class="nt">-fsSL</span> https://download.docker.com/linux/ubuntu/gpg |
    <span class="nb">sudo </span>gpg <span class="nt">--dearmor</span> <span class="nt">-o</span> /usr/share/keyrings/docker-archive-keyring.gpg

<span class="c"># Refreshes apt repos:</span>
<span class="nb">sudo </span>apt-get update

<span class="c"># Installs Docker CE:</span>
<span class="nb">sudo </span>apt-get <span class="nb">install </span>docker-ce docker-ce-cli containerd.io


<span class="c"># Ensures docker group exists:</span>
<span class="nv">$ </span><span class="nb">sudo </span>groupadd docker

<span class="c"># Ensures you are part of it:</span>
<span class="nv">$ </span><span class="nb">sudo </span>usermod <span class="nt">-aG</span> docker <span class="nv">$USER</span>

<span class="c"># Close your shell and reopen to make sure you're in the correct group (docker):</span>
<span class="nb">groups</span>

<span class="c"># Open ~/.profile and add:</span>
<span class="k">if </span>service docker status 2&gt;&amp;1 | <span class="nb">grep</span> <span class="nt">-q</span> <span class="s2">"is not running"</span><span class="p">;</span> <span class="k">then
    </span>wsl.exe <span class="nt">-d</span> <span class="s2">"</span><span class="k">${</span><span class="nv">WSL_DISTRO_NAME</span><span class="k">}</span><span class="s2">"</span> <span class="nt">-u</span> root <span class="nt">-e</span> /usr/sbin/service docker start <span class="o">&gt;</span>/dev/null 2&gt;&amp;1
<span class="k">fi</span>
</code></pre></div></div>

<p>Even after manually starting the service (<code class="language-plaintext highlighter-rouge">sudo service docker start</code>), I would run the ‘hello-world’ test and get an error:</p>

<div class="language-bash highlighter-rouge"><div class="highlight"><pre class="highlight"><code>user@hostname:~<span class="nv">$ </span>docker version

Client: Docker Engine - Community
 Version:           20.10.11
 API version:       1.41
 Go version:        go1.16.9
 Git commit:        dea9396
 Built:             Thu Nov 18 00:37:06 2021
 OS/Arch:           linux/amd64
 Context:           default
 Experimental:      <span class="nb">true

</span>Cannot connect to the Docker daemon at unix:///var/run/docker.sock. Is the docker daemon running?
</code></pre></div></div>

<p>The above error along with others was indicating <code class="language-plaintext highlighter-rouge">iptables</code> couldn’t be found. Even when I manually check for iptables, I found it’s not installed! How could this be? Now, were shifting from running and troubleshooting docker to investigation why iptables isn’t included in Ubuntu.</p>

<p>Turns out, <code class="language-plaintext highlighter-rouge">iptables</code> isn’t included with Ubuntu distro using WSL version 1. Unknowingly, I was using WSL1 not WSL2.</p>

<p>You can check that in a Windows command prompt:</p>

<div class="language-text highlighter-rouge"><div class="highlight"><pre class="highlight"><code>wsl -l -v
  NAME      STATE           VERSION
* Ubuntu    Running         1
</code></pre></div></div>

<p>You can set a version number by:</p>

<div class="language-text highlighter-rouge"><div class="highlight"><pre class="highlight"><code>wsl --set-version ubuntu 2
</code></pre></div></div>

<p>When I did this, I received an error from Microsoft about a “kernel update package” and a hyperlink:
<a href="https://docs.microsoft.com/en-us/windows/wsl/install-manual#step-4---download-the-linux-kernel-update-package">https://docs.microsoft.com/en-us/windows/wsl/install-manual#step-4—download-the-linux-kernel-update-package</a></p>

<p>You’ll need to install the Kernel Update Package as administrator.</p>

<p>Then, set the version of WSL for your distro:</p>
<div class="language-text highlighter-rouge"><div class="highlight"><pre class="highlight"><code>wsl --set-version ubuntu 2
</code></pre></div></div>

<p>It takes a few minutes to convert, but once it does, I was able to open ubuntu and the <code class="language-plaintext highlighter-rouge">iptables</code> command worked perfectly as well as starting the Docker daemon.</p>

<p>I’ve set my default WSL version to “2” using: <code class="language-plaintext highlighter-rouge">wsl --set-default-version 2</code></p>

<p>I am now a WSL lover and trying to incorporate it in many of my workflows.</p>]]></content><author><name></name></author><category term="docker" /><category term="WSL" /><category term="WSL2" /><summary type="html"><![CDATA[How to run docker on Win10 using WSL2 and troubleshooting common problems.]]></summary></entry><entry><title type="html">WiresharkFest 2021 (US)</title><link href="https://blog.showipintbri.com/blog/sharkfest-2021" rel="alternate" type="text/html" title="WiresharkFest 2021 (US)" /><published>2021-09-20T00:00:00-05:00</published><updated>2021-09-20T00:00:00-05:00</updated><id>https://blog.showipintbri.com/blog/sharkfest-2021</id><content type="html" xml:base="https://blog.showipintbri.com/blog/sharkfest-2021"><![CDATA[<p>SharkFest the anual wireshark developer conference has just concluded and I had an absolute blast! I bought a pass to all 3 pre-conference training classes (spanning 4-days) and also a full-conference pass:</p>
<ul>
  <li>2-Day Network Analysis and TCP Deep Dive with Wireshark (Chris Greer)</li>
  <li>Next Generation Protocols &amp; Advanced Network Analysis (Phill Shade)</li>
  <li>Analyzing Pcaps Faster with Filters (Betty DuBois)</li>
</ul>

<p><strong>This year I presented at SharkFest!</strong> My presentation was titled “<em>School from Home: Watching the wire with Wireshark</em>” where I talked about some interested traffic I found coming from the school provided Chromebooks and how I took a deeper dive to taking advantage of implied trust. (When ever the video gets posted to YouTube I’ll include a link)</p>

<p>I spent most of the 2nd day of conference presentation playing the CTF. The CTF this year was really well done with tons of challenges and some really hard ones too. If you want a CTF that focussed on packet captures and packet analysis this is the place to be. Overall I got 5th place out of 68 teams and I’m happy with that.</p>

<p align="center"><img src="/assets/images/posts/2021-09-20-sharkfest-21/ctf-scoreboard.png" /></p>

<h3 id="something-worth-doing-is-worth-doing-twice---tony-e">“Something worth doing, is worth doing twice!” - Tony E.</h3>
<p>Because of a configuration error I realised after completing all my slides and generating my example PCAPs, I needed to spend most of my time during the training classes pulling double duty. I was halfway participating in class and the other half remaking my slides and PCAPs. I even spent most of Day-1 from the conference finalizing my slides and semi-rehearsing for my presentation.</p>

<h3 id="imposter-syndrome">Imposter Syndrome</h3>
<p>This was the first ‘conference’ I’ve spoken at. While I typically don’t have any major stage fright, I was feeling a bit nervous because everyone who was presenting were folks who I look up to as experts in the field of packet analysis and I was exeriencing some major imposter syndrome.</p>

<p>Despite my imposter syndrome, I felt good about the execution of my presentation. I would’nt have changed anything about my presentation except timing. I should’ve start of a little faster pace because at around the <em>halfway mark</em> I realized I only made it through 1/4th of my slides. I quickly picked up the pace and at that rate I felt was too fast and not comprehendible. I also had to gloss-over or skip some more in-depth analysis but… It is what it is. I’ll make that a <em>lessons Learned</em>.</p>

<h2 id="things-i-learned-from-sharkfest">Things I Learned From SharkFest</h2>

<h3 id="-emojis-in-the-column-headers-">😀 Emoji’s in the Column Headers 😁</h3>
<p>The Wireshark column headers supports unicode characters, such as emojis. As soon as I learned this I started graffiti’ing my profiles with pointless and rediculous smiley faces. This might seem useless but there are a few practical uses:</p>
<ul>
  <li>Columns related to time can get a fancy stopwatch: ⏱</li>
  <li>Delta columns can get a: 🔺 (or any ‘delta’ style shape)</li>
</ul>

<h3 id="coloring-rules-">Coloring Rules 🟥🟧🟨🟩🟦🟪🟫</h3>
<p>I’ve seen SharkFest presentations before where customizing you profiles can give you an advantage or efficiency when analyzing certain traffic. While it really just comes down to personal preferences, in the past I brushed this idea <em>under-the-rug</em> and focused on my protocol fundamentals. Well, maybe it’s a sense maturity, but I now recognize the value of coloring rules: It’s not just coloring rows for personal preference but also creating a column for your coloring rules and using the rule name as a filter.</p>

<p><em>Maybe this^ needs a blog post all on it’s own?</em></p>

<h3 id="pcap-file-structure">PCAP File Structure</h3>
<p>Recently I’ve needed to dive into the file structure of PCAP and PCAPng file types. See: <a href="https://showipintbri.github.io/blog/pcapng-hex">Modifying PCAPng File Structure Using A Raw Hex Editor</a> and <a href="https://twitter.com/showipintbri/status/1437070853062156296">https://twitter.com/showipintbri/status/1437070853062156296</a>.</p>

<p>I had no idea you could investigate the file structure itself within Wireshark. For that navigate to: <strong>View &gt; Reload as File Format/Capture</strong></p>

<p align="center"><img src="/assets/images/posts/2021-09-20-sharkfest-21/ws-file-format.png" /></p>

<p>^ This is exactly why I love attending conferences. You learn about cool projects people are doing. Tips &amp; Tricks to make your job easier and an opportunity to as experts questions!</p>

<h3 id="tcp-sacks-and-tcp-stream-graphs">TCP SACK’s and TCP Stream Graphs</h3>
<p>Last year I took Chris Greer’s TCP trainings prior to SharkFest. I learned a ton! Infact there was so much to learn I deffinitely didn’t absorb all of it. So, this year I signed up for the training again hoping that a second time going over the material it would sink-in a little more… and it did. My focus was on day 2 of the training as Day 1 is alot of TCP basics and Wireshark basics. Day 2 is some more advanced TCP topics such as TCP SACK and understanding stream graphs. &lt;- This was the content I came for.</p>

<p align="center"><img src="/assets/images/posts/2021-09-20-sharkfest-21/tcp-stream-graph.png" /></p>

<p>I was having trouble remembering which lines indicated the various TCP header components. Also, I just wanted more organic practice of looking at the graphs on real traffic to help train my eyes and my mind to recognize graph shapes and paterns.</p>

<h3 id="read-filters">Read Filters</h3>
<p>I often have to open files greater than 1 GB. This is one of the reasons I lean on so many other tools for processing large files before diving in with the Wireshark Microscope. Processing large captures in Wireshark is dificult because each time you change or update a display filter it needs to re-scan the entire file which can takes time. Read filters will apply to when you open the PCAP so your subsequent display filters will be on a much smaller sub-set of traffic.</p>

<p>The <strong>Read filter</strong> can be fore when to open a PCA from the Wireshark interface: <strong>File &gt; Open…</strong></p>

<p align="center"><img src="/assets/images/posts/2021-09-20-sharkfest-21/ws-read-filter.png" /></p>

<p><strong>NOTE:</strong> It is will still take time on initial load.</p>

<p><strong>NOTE:</strong> When a display filter is applied it can still take a long time if the after the read filter you still have alot of packets.</p>

<h3 id="window-scaling-omg-window-scaling">Window Scaling, OMG Window Scaling!!!</h3>
<p>During the CTF there was a challenge about TCP Window Scaling. This one took me a while. Alot longer than it should have but I was stuck on the fact that Wireshark was calculating the ‘Calculated Window Size’ for me and I couldn’t figure out the math it was use or hos it was deriving the values it was using. Sure I could’ve just popped into the chat and asked one of th emany experts on the subject but I really wanted to figure this out on my own.</p>

<p align="center"><img src="/assets/images/posts/2021-09-20-sharkfest-21/ws-wndw-scl.png" /></p>

<p>The Window Scale value is a single byte in width. The <strong>Window Scale Factor</strong> is 2^[window Scale Value]: 2 to the ___th power.</p>

<p>This value, if the option is agreed upon from both end points, is applied to all TCP packets after the SYN &amp; SYN/ACK.</p>

<p>Reference: <a href="https://datatracker.ietf.org/doc/html/rfc1323#page-8">https://datatracker.ietf.org/doc/html/rfc1323#page-8</a></p>

<p>I title this section “Window Scaling, OMG Window Scaling” because there’s something to be said about memory and emotions. I don’t know the exact science behind it but you are much more likely to remember shomething if you have a specific emotion tied to that event or that thing. In this case, the emotion I felt when finally sorting out the window scaling I’ll never forget this now. Forever it will be burned in my brain as: “Two to the __nth!”</p>

<h2 id="in-conclusion">In Conclusion</h2>
<p>While it’s been on my radar for much longer, Sharkfest has been amazing for me over the past 2 years. I have learned so much about packet analysis and understanding the network traffic that uses the plumbing we(network engineers) build. I also had fun hanging out in the “Developerd Den” where I was chatting and interacting with some of Wiresharks core developers. I was able to ask about certain features and make suggestions for upcoming features. Wireshark truly is an amazing project with a great community around it 🤘.</p>]]></content><author><name></name></author><category term="wireshark" /><category term="sharkfest" /><category term="tcp" /><category term="2021" /><summary type="html"><![CDATA[SharkFest just concluded and it was better than ever. Let's dive into a quick review.]]></summary></entry><entry><title type="html">Build Your Own IPS w/ Suricata Container on VyOS Router</title><link href="https://blog.showipintbri.com/blog/suricata-vyos" rel="alternate" type="text/html" title="Build Your Own IPS w/ Suricata Container on VyOS Router" /><published>2021-06-13T00:00:00-05:00</published><updated>2021-06-13T00:00:00-05:00</updated><id>https://blog.showipintbri.com/blog/suricata-vyos</id><content type="html" xml:base="https://blog.showipintbri.com/blog/suricata-vyos"><![CDATA[<p>In this post I’m going to walk through building a best-in-class, in-line, fail-open, IPS using a Suricata container running on a VyOS router.</p>

<p>After reading a <a href="https://blog.vyos.io/vyos-project-may-2021-update">recent blog</a> from the VyOS dev team demonstrating an example of supporting containers natively from the VyOS CLI, I knew I had to try it with Suricata. Combining an amazing routing platform, with best in class Network Security Monitoring (NSM) and Intrusion Prevention System (IPS), both of which are Free and Open Source Software (FOSS) has been a dream of mine.</p>

<p><strong>INB4:</strong> Yes, I am well aware that pfsense and OPNsense has Suricata and FRR plugin’s available. I’ll withold my opinions of them from this post and save my commentary on them for a different post. (I’m not a fan! :hushed:)</p>

<h2 id="the-problem-statement">The Problem Statement:</h2>
<p>I needed to build a proof-of-concept to standardize the router/gateway/edge hardware for my companies locations.</p>
<ul>
  <li>Hardware should be my companies own hardware.</li>
  <li>Platform must support automation via ansible and API.</li>
  <li>Platform should be FOSS.</li>
  <li>Software should be modular. (the ability to add, remove or modify components as necessary)</li>
  <li>Network Security Monitoring (NSM), Intrusion Prevention System (IPS) and other Next-Gen FW capabilities should be supported.</li>
</ul>

<p>This blog doesn’t dive into automation or other resource and performance monitoring but, it is the first in a series of proof of concepts using my companies own hardware as an all-in-one platform that fits <em>our</em> needs. Hopefully many more fun usecases and experiments to come. 🤞</p>

<ul class="task-list">
  <li><strong>Proof of Concept:</strong><br />
    <ul class="task-list">
      <li class="task-list-item"><input type="checkbox" class="task-list-item-checkbox" disabled="disabled" checked="checked" />VyOS &amp; Suricata</li>
      <li class="task-list-item"><input type="checkbox" class="task-list-item-checkbox" disabled="disabled" />VyOS &amp; Zeek</li>
    </ul>
  </li>
  <li><strong>Performance Testing:</strong><br />
    <ul class="task-list">
      <li class="task-list-item"><input type="checkbox" class="task-list-item-checkbox" disabled="disabled" />VyOS &amp; Suricata on SN-3000 Hardware</li>
      <li class="task-list-item"><input type="checkbox" class="task-list-item-checkbox" disabled="disabled" />VyOS &amp; Zeek on SN-3000 Hardware</li>
    </ul>
  </li>
  <li class="task-list-item"><input type="checkbox" class="task-list-item-checkbox" disabled="disabled" />Automation Tooling</li>
  <li class="task-list-item"><input type="checkbox" class="task-list-item-checkbox" disabled="disabled" />Operational Playbooks</li>
</ul>

<h3 id="hardware-specifications">Hardware Specifications</h3>
<p>I’m using my companies own <a href="https://www.sealingtech.com/hardware/sn-3000/">SN-3000 series small form-factor node</a>. While this unit can support larger specs, I opted for reduced spec’d components:</p>
<ul>
  <li><strong>Memory:</strong> 128GB RAM</li>
  <li><strong>Storage:</strong> 128GB SSD</li>
  <li><strong>Processor:</strong> Intel(R) Xeon(R) D-2183IT CPU @ 2.20GHz</li>
</ul>

<table>
<tr>
<td><img style="max-width:100%" src="/assets/images/posts/2021-06-13-suricata-vyos/stech-sn3000-front.png" /></td>
<td><img style="max-width:100%" src="/assets/images/posts/2021-06-13-suricata-vyos/stech-sn3000-rear.png" /></td>
</tr>
</table>

<h3 id="platform-and-software-versions">Platform and Software Versions</h3>
<p>I’m calling the base VyOS a “platform”.</p>
<ul>
  <li><strong>Platform:</strong> VyOS 1.4-rolling-202105192127 (sagitta)</li>
  <li><strong>Podman:</strong> 3.0.1</li>
  <li><strong>Suricata:</strong> 6.0.2 (container)</li>
</ul>

<h3 id="network-architecture">Network Architecture</h3>
<p>I’m currently leveraging this box at my home, during the proof-of-concept period. It is acting as my internet gateway performing outbound NAT, basic stateful ACL’s and inter-VLAN routing (router-on-a-stick).</p>
<ul>
  <li>The layer-2 trunk uplink from my switch to the SN-3000 is 1Gbps copper.</li>
  <li>The link from the SN-3000 to my ONT CE (FTTH) is 1Gbps copper with 1Gbps CIR from my ISP.</li>
</ul>

<h2 id="tldr-heres-the-code">TL;DR: Here’s the Code</h2>

<h4 id="1-edit-registriesconf-and-add-the-docker-registry">1. Edit registries.conf and add the docker registry:</h4>
<div class="language-bash highlighter-rouge"><div class="highlight"><pre class="highlight"><code><span class="nb">sudo </span>nano /etc/containers/registries.conf
</code></pre></div></div>

<h4 id="2-uncomment-and-change-examplecom--to--dockerio-save-and-exit">2. Uncomment and change “example.com” -to-&gt; “docker.io”, save and exit.</h4>
<div class="language-bash highlighter-rouge"><div class="highlight"><pre class="highlight"><code>unqualified-search-registries <span class="o">=</span> <span class="o">[</span><span class="s2">"docker.io"</span><span class="o">]</span>
</code></pre></div></div>

<h4 id="3-pull-the-suricata-container">3. Pull the Suricata container:</h4>
<div class="language-bash highlighter-rouge"><div class="highlight"><pre class="highlight"><code><span class="nb">sudo </span>podman pull jasonish/suricata:latest
</code></pre></div></div>

<h4 id="4-verify">4. Verify:</h4>
<div class="language-bash highlighter-rouge"><div class="highlight"><pre class="highlight"><code><span class="nb">sudo </span>podman images
</code></pre></div></div>

<h4 id="5-create-a-directory-structure-to-store-rules-files-logs-and-configurations-between-container-restarts">5. Create a directory structure to store rules files, logs and configurations between container restarts.</h4>
<p>Below is my preference:</p>
<blockquote>
  <div class="language-plaintext highlighter-rouge"><div class="highlight"><pre class="highlight"><code>   ~/suricata/
      |
      |-etc/ (suricata configurations and rule exclusions)
      |-logs/ (suricata stats.log, fast.log &amp; eve.json)
      |-rules/ (suricata combined rules files)
</code></pre></div>  </div>
</blockquote>

<div class="language-bash highlighter-rouge"><div class="highlight"><pre class="highlight"><code><span class="nb">cd</span> ~ <span class="o">&amp;&amp;</span> <span class="nb">mkdir </span>suricata <span class="o">&amp;&amp;</span> <span class="nb">cd </span>suricata <span class="o">&amp;&amp;</span> <span class="nb">mkdir </span>etc <span class="o">&amp;&amp;</span> <span class="nb">mkdir </span>rules <span class="o">&amp;&amp;</span> <span class="nb">mkdir </span>logs 
</code></pre></div></div>

<h4 id="6-verify-suricata-was-built-with-nfq-support">6. Verify suricata was built with NFQ support:</h4>
<div class="language-bash highlighter-rouge"><div class="highlight"><pre class="highlight"><code><span class="c"># From within ~/suricata/ run:</span>

<span class="nb">sudo </span>podman run <span class="nt">--rm</span> <span class="nt">-it</span> <span class="nt">--net</span><span class="o">=</span>host <span class="se">\</span>
     <span class="nt">--cap-add</span><span class="o">=</span>net_admin <span class="nt">--cap-add</span><span class="o">=</span>sys_nice <span class="se">\</span>
     <span class="nt">-v</span> <span class="si">$(</span><span class="nb">pwd</span><span class="si">)</span>/logs:/var/log/suricata <span class="se">\</span>
     <span class="nt">-v</span> <span class="si">$(</span><span class="nb">pwd</span><span class="si">)</span>/etc:/etc/suricata <span class="se">\</span>
     <span class="nt">-v</span> <span class="si">$(</span><span class="nb">pwd</span><span class="si">)</span>/rules:/var/lib/suricata <span class="se">\</span>
         jasonish/suricata:latest <span class="nt">--build-info</span>
</code></pre></div></div>
<p>From the output printed, look for:  <code class="language-plaintext highlighter-rouge">NFQueue support: yes</code></p>

<h2 id="-stop">🛑 STOP!</h2>
<p>When you ran the command above in Step #6, the suricata container started, checked the directories for its configuration files, didn’t find any, and placed the default configuration files in the default directory: <code class="language-plaintext highlighter-rouge">~/suricata/etc/suricata.yaml</code>, then it ran with the <code class="language-plaintext highlighter-rouge">--build-info</code> flag and stopped.</p>

<p>This means you now have a default <code class="language-plaintext highlighter-rouge">suricata.yaml</code> file in <code class="language-plaintext highlighter-rouge">~/suricata/etc/</code> that you can modify to configure suricata to run and operate how we need it.</p>

<p>Best practice is to make a backup copy of this default YAML file so you can always revert to default if you booger up your configuration.</p>

<h2 id="-go">🟢 GO!</h2>
<h4 id="7-configure-suricatayaml">7. Configure suricata.yaml</h4>
<p>Edit <code class="language-plaintext highlighter-rouge">~/suricata/etc/suricata.yaml</code> to suit your needs. All of the available configuration options in this YAML file is way to much to review in this short blog. Please see <a href="https://suricata.readthedocs.io/en/suricata-6.0.2/configuration/suricata-yaml.html">https://suricata.readthedocs.io/</a> for a much more verbose description of the configuration file content and options.</p>

<p>Below are just <em>some</em> of the options I changed for <strong>my use case</strong>.</p>
<table>
	<tr>
		<td align="left"><b>Original suricata.yaml</b></td>
		<td align="left"><b>My suricata.yaml</b></td>
	</tr>
	<tr>
		<td align="left">
<pre>
outputs:
  - eve-log:
      community-id: false
      types:
        - anomaly:
	    enabled: yes
</pre>
		</td>
		<td align="left">
<pre>
outputs:
  - eve-log:
      community-id: <b>true</b>
      types:
        - anomaly:
	    enabled: <b>no</b>
</pre>
		</td>
	</tr>
	<tr>
		<td align="left">
<pre>
host-mode: auto
</pre>
		</td>
		<td align="left">
<pre>
host-mode: <b>router</b>
</pre>
		</td>
	</tr>
	<tr>
		<td align="left">
<pre>
nfq:
#  mode: accept
#  repeat-mark: 1
#  repeat-mask: 1
#  bypass-mark: 1
#  bypass-mask: 1
#  route-queue: 2
#  batchcount: 20
#  fail-open: yes
</pre>
		</td>
		<td align="left">
<pre>
nfq:
<b>  mode: accept</b>
#  repeat-mark: 1
#  repeat-mask: 1
#  bypass-mark: 1
#  bypass-mask: 1
#  route-queue: 2
#  batchcount: 20
<b>  fail-open: yes</b>
</pre>
		</td>
	</tr>
</table>

<p>The Suricata documentation has a really good section explaining the various <a href="https://suricata.readthedocs.io/en/suricata-6.0.2/configuration/suricata-yaml.html#nfq">nfq modes</a>.</p>

<h4 id="8-start-the-suricata-container">8. Start the suricata container:</h4>
<p><strong>NOTE:</strong> Since this is purely a <em>proof of concept</em> and not optimized for performance, I’m leveraging a single queue.</p>
<div class="language-bash highlighter-rouge"><div class="highlight"><pre class="highlight"><code><span class="c"># From within ~/suricata/ run:</span>

<span class="nb">sudo </span>podman run <span class="nt">--rm</span> <span class="nt">-itd</span> <span class="nt">--net</span><span class="o">=</span>host <span class="se">\</span>
     <span class="nt">--cap-add</span><span class="o">=</span>net_admin <span class="nt">--cap-add</span><span class="o">=</span>sys_nice <span class="se">\</span>
	 <span class="nt">--name</span><span class="o">=</span>suricata <span class="se">\</span>
     <span class="nt">-v</span> <span class="si">$(</span><span class="nb">pwd</span><span class="si">)</span>/logs:/var/log/suricata <span class="se">\</span>
     <span class="nt">-v</span> <span class="si">$(</span><span class="nb">pwd</span><span class="si">)</span>/etc:/etc/suricata <span class="se">\</span>
     <span class="nt">-v</span> <span class="si">$(</span><span class="nb">pwd</span><span class="si">)</span>/rules:/var/lib/suricata <span class="se">\</span>
         jasonish/suricata:latest <span class="nt">-q</span> 1
</code></pre></div></div>
<p><strong>Verify:</strong>
Check the: <code class="language-plaintext highlighter-rouge">~/suricata/logs/suricata.log</code> file to verify everything is starting correctly.</p>

<p>Regarding this particular setup I’m looking for:</p>
<div class="language-plaintext highlighter-rouge"><div class="highlight"><pre class="highlight"><code>11/6/2021 -- 17:37:00 - &lt;Info&gt; - Enabling fail-open on queue
11/6/2021 -- 17:37:00 - &lt;Info&gt; - NFQ running in standard ACCEPT/DROP mode
</code></pre></div></div>

<h4 id="9-add-the-required-iptables-rule-to-forward-traffic-to-suricata">9. Add the required <code class="language-plaintext highlighter-rouge">iptables</code> rule to forward traffic to suricata:</h4>
<p>Because IPS rules/signatures are more computationally expensive than firewall rules(tuple matching/connection tracking). I follow the basic principal that firewall rules should be processed before IPS rules/signatures. While my SN-3000 has way more horsepower than I need for my home traffic and can process all my traffic through IPS I still follow the principal. For that reason I only send packets to Suricata only <em>after</em> they been filtered by iptables. This is why I insert this rule as #4 in the FORWARD chain. On the flip side I could insert a similar iptables rule first and send all traffic to suricata before it hits the iptables rules defined by my VyOS configuration.</p>

<p>To understand this a little please read through the suricata <a href="https://suricata.readthedocs.io/en/suricata-6.0.2/configuration/suricata-yaml.html#nfq">doumentation on NFQ</a>.</p>

<p><strong>NOTE:</strong> Since this is purely a <em>proof of concept</em> and not optimized for performance, I’m leveraging a single queue.</p>
<div class="language-bash highlighter-rouge"><div class="highlight"><pre class="highlight"><code><span class="nb">sudo </span>iptables <span class="nt">-I</span> FORWARD 4 <span class="nt">-p</span> all <span class="nt">-j</span> NFQUEUE <span class="nt">--queue-bypass</span> <span class="nt">--queue-num</span> 1
</code></pre></div></div>
<p><strong>If you need to remove:</strong> Assuming your rule is still number 4 in the FORWARD chain (verify with: <code class="language-plaintext highlighter-rouge">sudo iptables -L FORWARD -n --line-numbers</code>)</p>
<div class="language-bash highlighter-rouge"><div class="highlight"><pre class="highlight"><code><span class="nb">sudo </span>iptables <span class="nt">-D</span> FORWARD 4
</code></pre></div></div>

<h4 id="10-enable-rule-sources-and-restart-suricata">10. Enable rule sources and restart suricata:</h4>
<div class="language-plaintext highlighter-rouge"><div class="highlight"><pre class="highlight"><code>sudo podman exec -it --user suricata suricata suricata-update
sudo podman exec -it --user suricata suricata suricata-update list-sources
sudo podman exec -it --user suricata suricata suricata-update list-enabled-sources
sudo podman exec -it --user suricata suricata suricata-update enable-source et/open
sudo podman exec -it --user suricata suricata suricata-update enable-source oisf/trafficid
sudo podman exec -it --user suricata suricata suricata-update -f
</code></pre></div></div>

<h4 id="11-check-your-logs">11. Check your logs</h4>
<p>Check the logs directory and verify your files are growing. Verify their contents. Enjoy. Happy Hacking!</p>

<h2 id="circling-back">Circling Back</h2>
<p>The inspiration of this proof-of-concept was derrived from the <a href="https://blog.vyos.io/vyos-project-may-2021-update">VyOS blog</a>. In that blog, containers are instantiated using the native VyOS CLI and configuration style. The process I documented above doesn’t leverage the VyOS CLI or configuration style because I’m not sure how to leverage the CLI’s <code class="language-plaintext highlighter-rouge">container</code> statements and pass it some of the necessary <code class="language-plaintext highlighter-rouge">--cap-add</code> options. I don’t foresee any issues running this via native linux versus the VyOS configuration style. If we want suricata to start post boot we can add it to the <code class="language-plaintext highlighter-rouge">/config/scripts/vyos-postconfig-bootup.script</code>. I’m fine with manually starting it for now.</p>

<h2 id="fail-open-by-design-my-preference">Fail open by design (my preference)</h2>
<p><strong>NOTE:</strong> This is my preference only! By tweaking some of the configuration this setup can be changed to fail-closed if you prefer. Please consult your organizations policy on fail-open network equipment.</p>

<p>Because this appliance is currently my internet gateway and I have an active household (school &amp; work) I can’t let my <em>mucking around</em> with suricata affect the egress or ingress traffic. For my home-usecase having a blindspot from suricata is of much less importance than having 99.999% uptime.</p>

<p>There are 2 configurations that drive this “<em>fail-open</em>” design:</p>
<ul>
  <li><code class="language-plaintext highlighter-rouge">--queue-bypass</code> in our iptables rule</li>
  <li><code class="language-plaintext highlighter-rouge">fail-open: yes</code> in our “nfq:” section of the suricata.yaml file</li>
</ul>

<p><strong><code class="language-plaintext highlighter-rouge">--queue-bypass</code></strong> is great because it allows VyOS to forward packets and filter them through the iptables/firewall rules that exist while, suricata is doing things like reloading a rules set. What this actually does is keeps the packets in the kernel and filtering them through iptables if a userspace application isn’t available to receive them from the specified queue.</p>

<p>Reference: <a href="https://ipset.netfilter.org/iptables-extensions.man.html">https://ipset.netfilter.org/iptables-extensions.man.html</a></p>
<blockquote>
  <p>By default, if no userspace program is listening on an NFQUEUE, then all packets that are to be queued are dropped. When this option is used, the NFQUEUE rule behaves like ACCEPT instead, and the packet will move on to the next table.</p>
</blockquote>

<p>For me this is perfect because of where in the FORWARD chain I put my NFQUEUE rule. I’m processing all my drop and reject iptables rules before the NFQUEUE rule is evaluated. If suricata isn’t available, then the packet is permitted. This doesn’t permit any unecessary packets that would otherwise be dropped because the following rule is an “ACCEPT all” rule. If I never bothered with suricata or if I don’t have suricata running, the packet would’ve passed anyway by ACL design.</p>

<p><strong><code class="language-plaintext highlighter-rouge">fail-open: yes</code></strong> is an available option baked in to suricata which says: ‘if suricata can’t keep up with the packets in the queue (when the queue is full), mark the incoming packets as ACCEPT. For this proof of concept this is acceptable until a baseline of performance can be measured and predicted.</p>

<h2 id="what-to-do-with-the-logs-and-events">What to do with the logs and events?</h2>
<p>If your hardware is powerful enough (and my SN-3000 is) you can host any number of databases, dashboards and search interfaces. Examples are: Splunk, Elasticsearch with Kibana, Graylog or something custom.
If your hardware is not powerful enough to run other containers in addition to suricata I would recommend shipping them off the box with the recommended shipper for your database platform. Examples could be: Logstash or some custom scripting.</p>

<h2 id="more-to-come">More to come</h2>
<p>While this is the end of <em>this</em> blog post it isn’t the end of my on-going project. I still need <strong>performance testing</strong>, <strong>automation tooling</strong> and <strong>operational playbooks</strong>.</p>
<ul class="task-list">
  <li><strong>Proof of Concept:</strong><br />
    <ul class="task-list">
      <li class="task-list-item"><input type="checkbox" class="task-list-item-checkbox" disabled="disabled" checked="checked" />VyOS &amp; Suricata</li>
      <li class="task-list-item"><input type="checkbox" class="task-list-item-checkbox" disabled="disabled" />VyOS &amp; Zeek</li>
    </ul>
  </li>
  <li><strong>Performance Testing:</strong><br />
    <ul class="task-list">
      <li class="task-list-item"><input type="checkbox" class="task-list-item-checkbox" disabled="disabled" />VyOS &amp; Suricata on SN-3000 Hardware</li>
      <li class="task-list-item"><input type="checkbox" class="task-list-item-checkbox" disabled="disabled" />VyOS &amp; Zeek on SN-3000 Hardware</li>
    </ul>
  </li>
  <li class="task-list-item"><input type="checkbox" class="task-list-item-checkbox" disabled="disabled" />Automation Tooling</li>
  <li class="task-list-item"><input type="checkbox" class="task-list-item-checkbox" disabled="disabled" />Operational Playbooks</li>
</ul>

<h3 id="what-other-containers-should-i-run-on-the-sn-3000-using-vyos-as-a-platform">What other containers should I run on the SN-3000 using VyOS as a Platform?</h3>

<h2 id="resources">Resources</h2>
<ul>
  <li><a href="https://blog.vyos.io/vyos-project-may-2021-update">https://blog.vyos.io/vyos-project-may-2021-update</a> (VyOS blog for demoing running containers via CLI)</li>
  <li><a href="https://suricata.readthedocs.io/en/suricata-6.0.2/configuration/suricata-yaml.html#nfq">https://suricata.readthedocs.io/en/suricata-6.0.2/configuration/suricata-yaml.html#nfq</a> (NFQ operation as explained by the Suricata Documentation)</li>
  <li><a href="https://github.com/jasonish/docker-suricata">https://github.com/jasonish/docker-suricata</a> (for a pre-packaged Suricata container)</li>
  <li><a href="https://docs.mirantis.com/mcp/q4-18/mcp-security-best-practices/use-cases/idps-vnf/ips-mode/nfq.html">https://docs.mirantis.com/mcp/q4-18/mcp-security-best-practices/use-cases/idps-vnf/ips-mode/nfq.html</a> (for help with understanding NFQ settings)</li>
  <li><a href="https://home.regit.org/netfilter-en/using-nfqueue-and-libnetfilter_queue/">https://home.regit.org/netfilter-en/using-nfqueue-and-libnetfilter_queue/</a> (for help understanding NFQUEUE operation)</li>
  <li><a href="https://suricata.readthedocs.io/en/suricata-6.0.2/setting-up-ipsinline-for-linux.html">https://suricata.readthedocs.io/en/suricata-6.0.2/setting-up-ipsinline-for-linux.html</a></li>
</ul>]]></content><author><name></name></author><category term="suricata" /><category term="vyos" /><category term="ips" /><category term="intrusion prevention" /><summary type="html"><![CDATA[In this post I'm going to walk through building a best-in-class, in-line, fail-open, IPS using a Suricata container running on a VyOS router.]]></summary></entry><entry><title type="html">SANS: FOR572 &amp;amp; Passing the GNFA!!!</title><link href="https://blog.showipintbri.com/blog/sans-for572" rel="alternate" type="text/html" title="SANS: FOR572 &amp;amp; Passing the GNFA!!!" /><published>2021-04-19T00:00:00-05:00</published><updated>2021-04-19T00:00:00-05:00</updated><id>https://blog.showipintbri.com/blog/sans-for572</id><content type="html" xml:base="https://blog.showipintbri.com/blog/sans-for572"><![CDATA[<h1 id="giac-network-forensic-analyst-nfa">GIAC: Network Forensic Analyst (NFA)</h1>
<p><strong>tl;dr</strong> This is not a humble brag but if you have good experience and are a professional in at least 1 or more related fields, it might not be too difficult.</p>
<p align="center">
<img src="/assets/images/posts/2021-04-19-sans-for572/score.png" />
</p>
<p>On Monday (March 29, 2021) I passed my <a href="https://www.giac.org/certification/network-forensic-analyst-gnfa">GIAC: Network Forensic Analyst certification</a> exam with a 92%. For study resources I used the <a href="https://www.sans.org/cyber-security-courses/advanced-network-forensics-threat-hunting-incident-response/">SANS: FOR572</a> online video series, slides and books. I didn’t dedicate a ton of time into studying. Infact this probably took me nearly 100 days from the time I purchased the exam attempt and actually taking the exam. Within the 100 days were weeks when I didn’t crack a book or start a video.</p>

<h3 id="sans-for572">SANS FOR572</h3>
<p>In the SANS FOR572 series <a href="https://www.sans.org/profiles/philip-hagen/">Phil Hagen</a>(<a href="https://twitter.com/PhilHagen">@PhilHagen</a>) does a really great job of bringing you up from Zero-to-Hero throughout the course. In my opinion you <em>definitely</em> should have some basic experience in networking, security concepts like boundary defense, and understanding how things look on the wire and how they <strong>should</strong> look on the wire. If you only have a couple years of <strong>good experience</strong> in the field, spanning multiple domains, you should have no problem keeping up with the material. If you have less experience, it doesn’t mean you <strong>can’t</strong> pass the exam but, it may be more difficult. Phil speaks clearly and delivers the material very well, mixed with tales of personal experiences.</p>

<p>While I haven’t been doing incident response or digital forensics at all as part of my day job, I regularly participate in CTF’s chasing flags through an environment or hunting for flags through PCAPs. Most of the tools used throughout the course material I have running in production environments or have running here at my home for network visibility and “research”. I spent most of my career around traditional networking and network security products like firewalls, IPSs, Proxies and more. I understand multi-vendor and multi-capability security stacks well. So, when I saw the tools and concepts Phil Hagen was presenting in the material it felt very comfortable.</p>

<h3 id="the-exam">The Exam</h3>
<p>I come from a Cisco testing background having gone from CCNA to CCIE, I was happy to NOT see what are know in the industry as “Cisco Style Questions” where there are multiple correct answers and you have to pick the <em>most correct</em> answer. Instead, the GIAC: NFA exam was clear and there was a single answer for each question. This alleviates a lot of frustration that can sometimes occur through certification exams. I finished the exam with lots of time to spare.</p>

<h4 id="testing-outline">Testing outline:</h4>
<ul>
  <li>50 questions</li>
  <li>2 hours</li>
  <li>Open Book !!!</li>
</ul>

<p>This was the first exam I’ve ever taken that was an open book test. It was weired and frankly I forgot to reference them throughout the test. There were a few questions where I paused as I was looking over the multiple choice answers and remembered: “Oh right, I can look this up!”, I would thumb through the book to the relevant section and skim and page or two until I could verify my intended answer. Without the books I still would’ve passed but not gotten as high of a score.</p>

<h3 id="index-method">Index Method</h3>
<p>I did not use the index method. I read as much as I could about this and watched a few ‘how-to’ videos but I just didn’t understand it. I started a spreadsheet but got about 25-rows done and gave up. It’s not for me. I see the value in it so I’m happy it works for many others but it’s not for me.</p>

<h3 id="practice-exams">Practice Exams</h3>
<p>I purchased 2 practice exams with my certification attempt. When I was about halfway through the material I took one, just to see if I was ready because frankly I was getting tired of studying and just wanted to get it out of the way. I scored well but ultimately decided to push through all the material before taking my certification attempt. The night before my certification attempt I took my 2nd practice exam and I scored even better. At that point I felt confident I would at least pass the exam, regardless of score. During the practice exams I didn’t use the books very often, 2 or 3 times maybe. I did feel like the practice exams were a good representation of the certification exam. I don’t believe they are from the same question pool, but they are similar so read the questions carefully and look at the diagrams carefully.</p>

<h3 id="why">Why?</h3>
<blockquote>
  <p>If you don’t do DFIR why take this exam?</p>
</blockquote>

<p>I’m not sure why I pursued this as opposed to any other certifications. Personally, I always wanted to be the “anti-hacker”. The guy who could use a bunch of crazy commands CLI filtering to find the needle in the haystack. There’s something about the ‘hunt’ that I love. Also, “Network Forensic Analyst” sounds pretty cool! Ultimately, because I don’t do this everyday for a living, I just wanted a way to learn more, and by pursuing a certification with a proven curriculum of study material seemed the best way to learn.</p>

<h3 id="what-did-i-learn">What did I learn?</h3>
<p>I learned a bunch of things. There were some tools that I was unaware of such as: <a href="https://tools.netsa.cert.org/silk/">silk</a>, <a href="https://github.com/phaag/nfdump">nfdump</a>, and the value of proxy logs. Also, through demonstration and exercises I learned some additional filtering and flags for various CLI tools that I needed more practice on.</p>

<h3 id="the-hug-of-thunder">The Hug of Thunder</h3>
<p>When I started this journey I put a question on on twitter to see who (if anyone) is pursuing a SANS certification other than myself. I received only a few replies but one very important was from <a href="https://twitter.com/HugOfThunder">Andre</a>. He mentioned he was just starting <a href="https://www.sans.org/cyber-security-courses/intrusion-detection-in-depth/">SEC503</a>. We became daily DM buddies, checking in on each others progress and what we’ve learned. If it wasn’t for this encouragement I might have let this one slip. For the record SEC503 and FOR572 overlap a little bit so we had some common ground between us. I wish him the best on his exam and because of all the great things I’ve heard and seen from the course material, I look forward to completing the SEC503 exam this year too!</p>

<h3 id="can-you-pass-the-cert-without-the-training">Can you pass the cert without the training?</h3>
<p>I’m not sure I can weigh in on this. Everyone is different. I even asked this question to Phil Hagan via a Slack we have in common. I think no matter what certification you are going for you should always take the tailored training. I know, in the case of SANS, it’s expensive, but so is failing the exam. It’s a gamble. I say <strong>TAKE THE TRAINING</strong>, you’ll learn something.</p>

<h3 id="giac-advisory-board">GIAC Advisory Board</h3>
<p>Because I scored above a 90% I got an invite to the GIAC Advisory Board. It’s a mailing list with threads related to current events, certifications, and general IT and security focused queries.</p>

<h4 id="on-to-the-next-one"><em>…on to the next one!</em></h4>]]></content><author><name></name></author><category term="sans" /><category term="giac" /><category term="certifications" /><category term="network forensics" /><summary type="html"><![CDATA[My review of SANS FOR572 training and GIAC's Network Forensic Analyst certification exam.]]></summary></entry><entry><title type="html">Modifying PCAPng File Structure using a Raw Hex Editor</title><link href="https://blog.showipintbri.com/blog/pcapng-hex" rel="alternate" type="text/html" title="Modifying PCAPng File Structure using a Raw Hex Editor" /><published>2021-04-14T00:00:00-05:00</published><updated>2021-04-14T00:00:00-05:00</updated><id>https://blog.showipintbri.com/blog/pcapng-hex</id><content type="html" xml:base="https://blog.showipintbri.com/blog/pcapng-hex"><![CDATA[<dl>
  <dt><strong>tl;dr</strong></dt>
  <dd>By manually changing the Linktype using a hex editor in the Interface Description Block (IDB) of the PCAPng file will convince the packet analysis software that only 1 type of interfaces were available at the time of capture.</dd>
</dl>

<p><strong>WARNING:</strong> Throughout this post I reference “PCAP” and “PCAPng” interchangeably. I also perform operations on files who have the extension *.pcap while their file structure is actually *.pcapng . Everything in this post whether *.pcap or *.pcapng should be *.pcapng. Thank you.</p>

<p>In one of my recent blog posts I discussed how some packet analysis tools have trouble processing a PCAPng file containing more than 1 interface type. Specifically I had a PCAPng file containing:</p>
<ul>
  <li>LINKTYPE_ETHERNET (1)</li>
  <li>LINKTYPE_LINUX_SLL (113)</li>
</ul>

<p>See that post <a href="https://showipintbri.github.io/blog/sll-tracewrangler">here</a>.</p>

<p>At the bottom of that post I left with an indication that this could be done manually but I wasn’t quite sure how. This unanswered question has bothered me. I needed to know “Why?” and “How?”. This led to a path I never thought I’d cross: Manually editing raw hex to manipulate files.</p>

<p>My idea at the time was if we split the packets from the PCAPng file into 2 separate files each containing traffic from only 1 interface type, the packet analysis tools should have no problem processing them individually.</p>

<p>Using <strong>tshark</strong> I split the protocols into 2 files:</p>
<div class="language-plaintext highlighter-rouge"><div class="highlight"><pre class="highlight"><code>tshark -r &lt;input_file.pcapng&gt; -w eth.pcapng -Y "eth"
tshark -r &lt;input_file.pcapng&gt; -w sll.pcapng -Y "sll"
</code></pre></div></div>

<p>The above tshark commands will create 2 PCAPng files each containing only like-traffic using the display filter. With wireshark you can verify all the packets are alike within each file. Each tool tested (Zeek, Suricata, Brim &amp; tcpdump) still gives the same error processing these new PCAPs as they did when processing the single PCAP containing both Layer-2 protocols. (see this <a href="https://showipintbri.github.io/blog/sll-tracewrangler">blog post</a>)</p>

<h1 id="hypothesis">Hypothesis</h1>
<p>I’m thinking there are still artifacts in the new PCAPng files referencing the additional interfaces from the original PCAPng file.</p>

<p><em>…but where?</em></p>

<h2 id="a-clue">A Clue</h2>
<p>When you open the new PCAPng files (eth.pcapng &amp; sll.pcapng), even though they each contain only 1 type of Layer-2 header, in the <strong>Capture File Properties</strong> you’ll see 2 types of interfaces listed under the “Link Type” column header.</p>

<p><img src="/assets/images/posts/2021-04-14-pcapng-hex/cap-prop-interfaces-before.png" alt="" /></p>

<p>Ah-ha! This data must still be contained in the file …<em>but where?</em></p>

<h2 id="understanding-the-pcapng-file-structure">Understanding the PCAPng File Structure</h2>
<p>To understand what’s going on you’ll need to understand the PCAPng file structure.</p>

<p>To summarize our issue with this specific PCAPng file and condense the information I will <strong>NOT</strong> step through every header, block field and options, instead I’ll give a high level description. Everything you’ll need to know about the PCAPng file structure is in the <a href="https://pcapng.github.io/pcapng/draft-tuexen-opsawg-pcapng.html">documentation</a>.</p>

<p>Below is an abstract image representing the compisition of our PCAPng file, reading from left–&gt;right. The file is broken up into different sections called blocks. Below is a summary of the file blocks we’re interested in.</p>

<p><img src="/assets/images/posts/2021-04-14-pcapng-hex/high-level.png" alt="" /></p>

<h3 id="block-types">Block Types</h3>
<ul>
  <li><strong>Section Header Block (SHB):</strong> Every PCAPng file must have at least 1 of these blocks but can have more. This does <strong>NOT</strong> contain packet data. It more like meta data around the file itself like the OS and version of the system the PCAPng file was created.</li>
  <li><strong>Interface Description Block (IDB):</strong> This block contains the Linktype values. This is where an interface is identified as LINKTYPE_ETHERNET (1) or LINKTYPE_LINUX_SLL (113). The order of these blocks determines the interface ID value. The first Interface Description Block becomes interface ID: 0. All subsequent Interface Description Blocks not separated by SHB’s are incremented by 1.</li>
  <li><strong>Enhanced Packet Block (EPB):</strong> This block contains the actual packet data from Layer-2 to Layer-7 and also indicates which interface ID this packet was captured from.</li>
</ul>

<p>Our PCAPng file closely resembles the “complex example” <a href="https://pcapng.github.io/pcapng/draft-tuexen-opsawg-pcapng.html#fssample-full">figure 6</a> from the documentation.</p>

<p>Our PCAPng file has 2 IDB blocks and inside each IDB is a different Link Type.</p>

<p>This is the source of our problem.</p>

<h3 id="pcapng-hex-dump">PCAPng Hex Dump</h3>
<p>Looking at the PCAPng file using a hex editor, I’ve outlined the sections using the same colors as the image in the previous section. I’ve also highlighted some values using bright yellow and green. The values highlighted in yellow represent the Link type and the values highlighted in green are the associated Interface ID for each EPB.</p>

<p><img src="/assets/images/posts/2021-04-14-pcapng-hex/hex-marked-up.png" alt="" /></p>

<p><strong>NOTE:</strong> The above hex dump should be read Little-Endian. <strong>Not all captures will be Little-Endian</strong>, that is left up to your local operating system.</p>

<table>
  <thead>
    <tr>
      <th style="text-align: center">Block Type</th>
      <th style="text-align: center">Highlighted Color</th>
      <th style="text-align: left">HEX</th>
      <th style="text-align: right">Decimal</th>
      <th style="text-align: left">Meaning</th>
      <th style="text-align: center">Notes</th>
      <th style="text-align: center">Interface ID</th>
    </tr>
  </thead>
  <tbody>
    <tr>
      <td style="text-align: center">IDP</td>
      <td style="text-align: center">Yellow</td>
      <td style="text-align: left">0x71</td>
      <td style="text-align: right">113</td>
      <td style="text-align: left">LINKTYPE_LINUX_SLL</td>
      <td style="text-align: center">Linux Cooked Capture</td>
      <td style="text-align: center">0</td>
    </tr>
    <tr>
      <td style="text-align: center">IDP</td>
      <td style="text-align: center">Yellow</td>
      <td style="text-align: left">0x01</td>
      <td style="text-align: right">1</td>
      <td style="text-align: left">LINKTYPE_ETHERNET</td>
      <td style="text-align: center">Ethernet Header</td>
      <td style="text-align: center">1</td>
    </tr>
    <tr>
      <td style="text-align: center">EPB</td>
      <td style="text-align: center">Green</td>
      <td style="text-align: left">0x01</td>
      <td style="text-align: right">1</td>
      <td style="text-align: left">Use interface ID 1</td>
      <td style="text-align: center">none</td>
      <td style="text-align: center">n/a</td>
    </tr>
  </tbody>
</table>

<p>Using the below image, something worth noting is, some of the info is explicitly contianed in the data (‘<em>included data</em>’) and some of the info is <em>derived</em> meaning it’s not actually reflected in the bytes or bits but is derived based on it’s placement in the file structure. The first IDB block becomes ‘interface id: 0’, the second IDB becomes ‘interface id: 1’, etc …:</p>

<p><img src="/assets/images/posts/2021-04-14-pcapng-hex/high-level-marked-up.png" alt="" /></p>

<p>In our case, using the example eth.pcapng file:</p>
<ul>
  <li><strong>All</strong> the packets reference interface ID: 1, which is the “LINKTYPE_ETHERNET” as their source interface.</li>
  <li><strong>None</strong> of the packets reference interface ID: 0, which is the “LINKTYPE_LINUX_SLL”.</li>
</ul>

<p>We should be able to change the Link type in the first listed IDB from 0x71 –&gt; 0x01 without casing an issue.</p>

<p>This will indicate to applications reading the PCAPng file that ‘<em>this file was produced on a system that was capturing on 2 interfaces and both were LINKTYPE_ETHERNET</em>’.</p>

<h1 id="my-process">My Process</h1>
<ol>
  <li>Using <code class="language-plaintext highlighter-rouge">tshark</code> split out the Layer-2 protocols into separate PCAPng files: <strong><em>eth-before.pcap</em></strong> &amp; <strong><em>sll-before.pcap</em></strong></li>
  <li>Manually edit the Interface Description Blocks (IDB) using a hex editor, making both LINKTYPE fields the same, either 0x71 or 0x01, and naming the files <strong><em>eth-after.pcap</em></strong> &amp; <strong><em>sll-after.pcap</em></strong>, respectively.</li>
  <li>Testing each pcap with: tcpdump, Suricata, Zeek &amp; Brim</li>
</ol>

<h2 id="definitions">Definitions</h2>
<dl>
  <dt><strong>Before</strong></dt>
  <dd>Each PCAP file contains only (1) Layer-2 protocol in the EPBs, but the SHB contains (2) IDBs with <strong><em>different</em></strong> LINKTYPEs.</dd>
  <dt><strong>After</strong></dt>
  <dd>Each PCAP file contains only (1) Layer-2 protocol in the EPBs and the SHB contains (2) IDBs which are the <strong><em>same</em></strong> LINKTYPE.</dd>
</dl>

<h1 id="results">Results</h1>
<p>After changing the values you can see from this screenshot, Wireshark now thinks both interfaces are the same.</p>

<h4 id="before">Before</h4>
<p><img src="/assets/images/posts/2021-04-14-pcapng-hex/cap-prop-interfaces-before.png" alt="" /></p>

<h4 id="after">After</h4>
<p><img src="/assets/images/posts/2021-04-14-pcapng-hex/cap-prop-interfaces-after.png" alt="" /></p>

<h4 id="compatibility-matrix">Compatibility Matrix</h4>

<table>
  <thead>
    <tr>
      <th style="text-align: left">Tool Name</th>
      <th style="text-align: center">Original Combined PCAP File</th>
      <th style="text-align: center">eth-before.pcapng</th>
      <th style="text-align: center">sll-before.pcapng</th>
      <th style="text-align: center">eth-after.pcapng</th>
      <th style="text-align: center">sll-after.pcapng</th>
    </tr>
  </thead>
  <tbody>
    <tr>
      <td style="text-align: left">Wireshark</td>
      <td style="text-align: center">Yes</td>
      <td style="text-align: center">Yes</td>
      <td style="text-align: center">Yes</td>
      <td style="text-align: center">Yes</td>
      <td style="text-align: center">Yes</td>
    </tr>
    <tr>
      <td style="text-align: left">tshark</td>
      <td style="text-align: center">Yes</td>
      <td style="text-align: center">Yes</td>
      <td style="text-align: center">Yes</td>
      <td style="text-align: center">Yes</td>
      <td style="text-align: center">Yes</td>
    </tr>
    <tr>
      <td style="text-align: left">tcpdump</td>
      <td style="text-align: center">No</td>
      <td style="text-align: center">No</td>
      <td style="text-align: center">No</td>
      <td style="text-align: center">Yes:+1:</td>
      <td style="text-align: center">Yes:+1:</td>
    </tr>
    <tr>
      <td style="text-align: left">zeek</td>
      <td style="text-align: center">No</td>
      <td style="text-align: center">No</td>
      <td style="text-align: center">No</td>
      <td style="text-align: center">Yes:+1:</td>
      <td style="text-align: center">Yes:+1:</td>
    </tr>
    <tr>
      <td style="text-align: left">suricata</td>
      <td style="text-align: center">No</td>
      <td style="text-align: center">No</td>
      <td style="text-align: center">No</td>
      <td style="text-align: center">Yes:+1:</td>
      <td style="text-align: center">Yes:+1:</td>
    </tr>
    <tr>
      <td style="text-align: left">Brim</td>
      <td style="text-align: center">No</td>
      <td style="text-align: center">No</td>
      <td style="text-align: center">No</td>
      <td style="text-align: center">Yes :+1:</td>
      <td style="text-align: center">Yes:+1:</td>
    </tr>
  </tbody>
</table>

<h3 id="example-processing-the-before--after-pcaps">Example Processing the Before &amp; After PCAPs</h3>
<h4 id="zeek-eth-beforepcap--eth-afterpcap">Zeek: eth-before.pcap &amp; eth-after.pcap</h4>
<p><img src="/assets/images/posts/2021-04-14-pcapng-hex/zeek-eth-error-no-error.jpg" alt="" /></p>

<h4 id="zeek-sll-beforepcap--sll-afterpcap">Zeek: sll-before.pcap &amp; sll-after.pcap</h4>
<p><img src="/assets/images/posts/2021-04-14-pcapng-hex/zeek-sll-error-no-error.jpg" alt="" /></p>

<h4 id="tcpdump-eth-beforepcap--eth-afterpcap">tcpdump: eth-before.pcap &amp; eth-after.pcap</h4>
<p><img src="/assets/images/posts/2021-04-14-pcapng-hex/tcp-dump-error-no-error.jpg" alt="" /></p>

<h2 id="wireshark-side-by-side">Wireshark Side-By-Side</h2>
<p>This shows the meta-data around duration and file size the same, with the Hash values changing because of the 1 byte that was modified.
<img src="/assets/images/posts/2021-04-14-pcapng-hex/wireshark-side-by-side.png" alt="" /></p>

<h3 id="packet-view-for-reference">Packet View for Reference</h3>
<p>If you wanted to correlate the Hex dump image from earlier in this post against how it’s shown in Wireshark, you would be looking at these 3 packets:
<img src="/assets/images/posts/2021-04-14-pcapng-hex/wireshark-3-packets.png" alt="" /></p>

<h2 id="questions">Questions</h2>
<ol>
  <li>
    <dl>
      <dt><strong>Why didn’t you just delete the unused/unreferenced Interface Description Block (IDB)?</strong></dt>
      <dd>Because of how the interfaces are ID’d, if all the packets we referencing ID #1 (the second IDB), I would have to re-write all the interface ID references in all the EPBs and point them to interface ID #0. I really just wanted to make as few changes as possible. Leaving an unused ‘ghost IDB’ didn’t seem to hurt anything as long as the LINKTYPE was the same.</dd>
    </dl>
  </li>
  <li>
    <dl>
      <dt><strong>What hex editor did you use?</strong></dt>
      <dd>I used the “hex editor” plugin for Notepad++. Since I don’t do this often, I don’t have a favorite tool.</dd>
    </dl>
  </li>
  <li>
    <dl>
      <dt><strong>How was the original PCAP created containing multiple LINKTYPE’s?</strong></dt>
      <dd>I’m not sure how the PCAP’s author originally created file but if you use linux and capture packets on a system that has multiple interfaces and use: <code class="language-plaintext highlighter-rouge">tcpdump -i any</code> this should generate a PCAP using Linux Cooked Capture (<code class="language-plaintext highlighter-rouge">sll</code>) and then again but this time specifying a single interface: <code class="language-plaintext highlighter-rouge">tcpdump -i eth0</code> and merge those files together, you’ll get a mixed IDB in the final PCAP file. <strong>NOTE:</strong> You may have to convert one or both to PCAPng file format first before merging.</dd>
    </dl>
  </li>
</ol>

<h2 id="reference-links">Reference Links</h2>
<ol>
  <li><a href="https://pcapng.github.io/pcapng/draft-tuexen-opsawg-pcapng.html">https://pcapng.github.io/pcapng/draft-tuexen-opsawg-pcapng.html</a></li>
</ol>]]></content><author><name></name></author><category term="pcap" /><category term="hex" /><category term="zeek" /><category term="suricata" /><category term="brim" /><summary type="html"><![CDATA[By manually changing the Linktype using a hex editor in the Interface Description Block (IDB) of the PCAPng file will convince the packet analysis software that only 1 type of interfaces were available at the time of capture.]]></summary></entry><entry><title type="html">Working With Linux Cooked Capture Headers Using TraceWrangler</title><link href="https://blog.showipintbri.com/blog/sll-tracewrangler" rel="alternate" type="text/html" title="Working With Linux Cooked Capture Headers Using TraceWrangler" /><published>2021-04-12T00:00:00-05:00</published><updated>2021-04-12T00:00:00-05:00</updated><id>https://blog.showipintbri.com/blog/sll-tracewrangler</id><content type="html" xml:base="https://blog.showipintbri.com/blog/sll-tracewrangler"><![CDATA[<h2 id="the-problem">The Problem</h2>
<p>Sometimes when loading a PCAP into various tools you get a cryptic error: <strong>an interface has a type 1 different from the type of the first interface</strong>. I had one PCAP that would generate various errors in different tools.</p>

<h3 id="the-evidence">The Evidence</h3>
<h4 id="brim">Brim:</h4>
<p><img src="/assets/images/posts/2021-04-12-sll-tracewrangler/brim-error.png" alt="" /></p>

<p>See this <a href="https://github.com/brimdata/brimcap/issues/19">Github issue</a> I raised.</p>
<p />

<h4 id="zeek">Zeek:</h4>
<div class="language-plaintext highlighter-rouge"><div class="highlight"><pre class="highlight"><code>root@server:~/ctf$ /opt/zeek/bin/zeek -C -r ctf-dump-v2.pcap
fatal error: failed to read a packet from ctf-dump-v2.pcap: an interface has a type 1 different from the type of the first interface
</code></pre></div></div>
<p />

<h4 id="suricata">Suricata:</h4>
<div class="language-plaintext highlighter-rouge"><div class="highlight"><pre class="highlight"><code>root@server:~$ suricata -r ctf-dump-v2.pcap -c /etc/suricata/suricata-debian.yaml
10/4/2021 -- 23:10:01 - &lt;Error&gt; - [ERRCODE: SC_ERR_PCAP_DISPATCH(20)] - error code -1 an interface has a type 1 different from the type of the first interface

</code></pre></div></div>
<p />

<h4 id="tcpdump">tcpdump:</h4>
<div class="language-plaintext highlighter-rouge"><div class="highlight"><pre class="highlight"><code>root@server:~$ tcpdump -r ctf-dump-v2.pcap
reading from file ctf-dump-v2.pcap, link-type LINUX_SLL (Linux cooked)
tcpdump: pcap_loop: an interface has a type 1 different from the type of the first interface

</code></pre></div></div>
<p />

<h4 id="wireshark--tshark">Wireshark &amp; tshark:</h4>
<p>Had no problems reading the PCAP.</p>

<h2 id="the-solution">The Solution</h2>
<p>To fix this issue we need to iterate through the PCAP re-writing the SLL frame headers with standard ethernet headers. Tracewrangler makes quick work of this. The more correct solution is for the application developers to impliment compatibility with this interface type or a mix of interface types in the same PCAP file.</p>

<h3 id="tracewrangler">Tracewrangler</h3>
<p><a href="https://www.tracewrangler.com/">Tracewrangler</a> is an awesome tool for manipulating PCAP files. It is written by Jasper Bongertz(<a href="https://twitter.com/PacketJay">@packetjay</a>) and has gotten me out of a few jambs. This tool performs an number of common PCAP file manipulation tasks quickly. For example:</p>
<ul>
  <li>Add or Remove a VLAN ID in the header</li>
  <li>Mask/re-write the src or dst MAC addresses</li>
  <li>Mask/re-write the src or dst IP addresses</li>
  <li>Slice off the payloads leaving only the headers</li>
  <li>^^^ Just to name a few, and many many more!!!</li>
</ul>

<h3 id="linux-cooked-capture-mode">Linux Cooked Capture Mode</h3>
<p>This is “Linux Cooked Capture Mode” and you can find frames using this header type in your PCAP’s using the Wireshark display filter: <code class="language-plaintext highlighter-rouge">sll</code>. This header is 16-bytes and as you can see very different from a standard Ethernet header. Some tools actually don’t have a problem processing PCAP’s which contain only SLL, but most will choke when they contain a mix of various Layer-2 headers(in my case a mix of <code class="language-plaintext highlighter-rouge">sll &amp;&amp; eth</code>). Frames using Ethernet headers are 14-bytes by default and can be isolated using the Wireshark display filter: <code class="language-plaintext highlighter-rouge">eth</code>.</p>

<table>
  <tbody>
    <tr>
      <td><img src="/assets/images/posts/2021-04-12-sll-tracewrangler/sll-header.png" style="max-width:100%" /></td>
      <td><img src="/assets/images/posts/2021-04-12-sll-tracewrangler/eth-header.png" style="max-width:100%" /></td>
    </tr>
  </tbody>
</table>

<p>NOTE: Alternatively, separate your different layer-2 protocols into seprate PCAPs. Most tools will be okay with this.</p>

<h3 id="lets-get-to-it">Let’s Get To It</h3>
<ol>
  <li>
    <p>Open TraceWrangler click the “Add Files” button and load the PCAP in question.<br />
<img src="/assets/images/posts/2021-04-12-sll-tracewrangler/trace-1.png" alt="" /></p>
  </li>
  <li>
    <p>For this particular operation use the “Edit Files” button.<br />
<img src="/assets/images/posts/2021-04-12-sll-tracewrangler/trace-2.png" alt="" /></p>
  </li>
  <li>
    <p>In the navigation tree select “Edit”, Check the box for “Replace Linux Cooked Header with Ethernet” and click “Okay”.<br />
<img src="/assets/images/posts/2021-04-12-sll-tracewrangler/trace-3.png" alt="" /></p>
  </li>
  <li>
    <p>Back on the main TraceWrangler window click “Run” in the bottom left.<br />
<img src="/assets/images/posts/2021-04-12-sll-tracewrangler/trace-4.png" alt="" /></p>
  </li>
</ol>

<h2 id="alternative-solution">Alternative Solution</h2>
<p>As mentioned above the root of the problem is the mix of interface types/Layer-2 header types in the same PCAP file. If you separate out the interface types you might be able to process the PCAPs separately. I haven’t found a clean way to accomplish this via CLI yet, I’ll update this blog post if I do.</p>

<div class="language-plaintext highlighter-rouge"><div class="highlight"><pre class="highlight"><code># Note this doesn't solve the problem but it does seperate out the traffic. however the interfaces are both still listed in the capture properties.
# Even though this doesn't work as expected I'm leaving here as a seed of an idea until I have something better.

tshark.exe -r "c:\Users\Tony\Downloads\ctf-dump-v2.pcap" -w "c:\Users\Tony\Downloads\sll.pcap" -Y "sll"

tshark.exe -r "c:\Users\Tony\Downloads\ctf-dump-v2.pcap" -w "c:\Users\Tony\Downloads\eth.pcap" -Y "eth"
</code></pre></div></div>

<h1 id="linksreferences">Links/References:</h1>
<ul>
  <li><a href="https://wiki.wireshark.org/SLL">https://wiki.wireshark.org/SLL</a></li>
  <li><a href="http://www.tcpdump.org/linktypes.html">http://www.tcpdump.org/linktypes.html</a></li>
  <li><a href="https://pcapng.github.io/pcapng/draft-tuexen-opsawg-pcapng.html">https://pcapng.github.io/pcapng/draft-tuexen-opsawg-pcapng.html</a> (Link Type: 1 &amp; 113)</li>
  <li><a href="https://linux.die.net/man/7/pcap-linktype">https://linux.die.net/man/7/pcap-linktype</a> (Link Type: 1 &amp; 113)</li>
</ul>]]></content><author><name></name></author><category term="pcap" /><category term="tracewrangler" /><category term="tcpdump" /><summary type="html"><![CDATA[This outlines how to use TraceWrangler to solve a real world issue when processing PCAPs with multiple interface types.]]></summary></entry><entry><title type="html">My First 2 Zeek Scripts</title><link href="https://blog.showipintbri.com/blog/my-first-zeek-scripts" rel="alternate" type="text/html" title="My First 2 Zeek Scripts" /><published>2021-04-09T00:00:00-05:00</published><updated>2021-04-09T00:00:00-05:00</updated><id>https://blog.showipintbri.com/blog/my-first-zeek-scripts</id><content type="html" xml:base="https://blog.showipintbri.com/blog/my-first-zeek-scripts"><![CDATA[<p><strong>tl;dr</strong> This blog post was for documentation purposes. Nothing to see here.</p>

<h2 id="problem-statement">Problem Statement:</h2>

<blockquote>
  <p>I need to have Zeek log every UDP packet instead of only per UDP session/conversation</p>
</blockquote>

<p>Because of Zeek’s session tracking it will only log one connection “uid” at the start of a session and for all subsequent packets which are part of the same session or conversation.</p>

<p>For example, using the popular <a href="http://tcpreplay.appneta.com/wiki/captures.html#smallflows-pcap">smallFlows.pcap</a> you can see there are <em>501</em> UDP packets:</p>
<div class="language-plaintext highlighter-rouge"><div class="highlight"><pre class="highlight"><code># tcpdump

tcpdump -nr smallFlows.pcap udp | wc -l
501

# Wireshark Display Filter:
udp &amp;&amp; !icmp
^^^ This count is 501 packets

# NOTE: You have to exclude 'icmp' because the Type-11's and Type-3's re-encapsulate the original UDP packet.
# You can identify these packets using the filter 'udp &amp;&amp; icmp'(&lt;-- this count is 22 packets).
# Using just 'udp' filter will result in also counting the icmp ecapsulated udp packets (&lt;-- this count is 523)
</code></pre></div></div>

<p />
<p>Using Zeek on the same PCAP and filtering the logs showing only protocol UDP yields a much lower count:</p>
<div class="language-plaintext highlighter-rouge"><div class="highlight"><pre class="highlight"><code>zeek -C -r smallFlows.pcap
grep udp conn.log | wc -l
173
</code></pre></div></div>

<p />
<p>So, where did all the other packets go? The packets are there but Zeek only creates a new log entry for every unique session. Packets that are part of the same flow or conversation are counted together. In fact if you use the below command and add up all the numbers in the 6th and 7th columns you’ll get 501:</p>
<div class="language-plaintext highlighter-rouge"><div class="highlight"><pre class="highlight"><code>cat conn.log | /opt/zeek/bin/zeek-cut id.orig_h id.orig_p id.resp_h id.resp_p proto orig_pkts resp_pkts uid | grep udp
</code></pre></div></div>
<p>NOTE: The 6th and 7th columns are the number of packets seen with the <strong>Orig</strong>inator as the <em>source</em> or the <strong>Resp</strong>onder as the <em>source</em> (on a per-packet analysis)</p>

<h2 id="how-do-we-get-zeek-to-log-each-udp-packet-instead-of-each-session-or-conversation">How do we get Zeek to log each UDP packet instead of each session or conversation?</h2>

<p>I’m glad you asked, I wrote a script for that!</p>

<p>This first script simply logs to STDOUT for every UDP request or UDP reply and logs them as individual unique connections.</p>
<h4 id="script-1-udp_scriptzeek">Script #1: udp_script.zeek</h4>
<div class="language-plaintext highlighter-rouge"><div class="highlight"><pre class="highlight"><code>event udp_request(u: connection){
# Choose one format to un-comment
#	print fmt("UDP Request: %s", u$id);
#	print fmt("%s UDP Request: %s %s --&gt; %s %s", u$uid, u$id$orig_h, u$id$orig_p, u$id$resp_h, u$id$resp_p);
	print fmt("UDP Request: %s %s --&gt; %s %s", u$id$orig_h, u$id$orig_p, u$id$resp_h, u$id$resp_p);
}

event udp_reply(u: connection){
# Choose the matching format from above to un-comment
#	print fmt("UDP Reply  : %s", u$id);
#	print fmt("%s UDP Reply  : %s %s &lt;-- %s %s", u$uid, u$id$orig_h, u$id$orig_p, u$id$resp_h, u$id$resp_p);
	print fmt("UDP Reply  : %s %s &lt;-- %s %s", u$id$orig_h, u$id$orig_p, u$id$resp_h, u$id$resp_p);
}
</code></pre></div></div>

<p />
<p>Lets run this script against our PCAP file:</p>
<div class="language-plaintext highlighter-rouge"><div class="highlight"><pre class="highlight"><code># NOTE: I'm in the same directory as my pcap and my script file. The Zeek binary is in its default location.

sudo /opt/zeek/bin/zeek -C -r smallFlows.pcap udp_script.zeek

UDP Request: 192.168.3.131 57757/udp --&gt; 239.255.255.250 1900/udp
UDP Request: 192.168.3.131 68/udp --&gt; 255.255.255.255 67/udp
UDP Request: 192.168.3.131 54600/udp --&gt; 224.0.0.252 5355/udp
UDP Request: 172.16.255.1 50983/udp --&gt; 71.224.25.112 33695/udp
[ ... OMITTED FOR BREVITY ... ]
</code></pre></div></div>

<p />
<p>Sweet, now lets make sure we have the same number of log lines as we do UDP packets in the PCAP:</p>
<div class="language-plaintext highlighter-rouge"><div class="highlight"><pre class="highlight"><code>sudo /opt/zeek/bin/zeek -C -r smallFlows.pcap udp_script.zeek | wc -l
501
</code></pre></div></div>

<p />
<p>Awsome! While this is great and proof that we are generating logs the way we intended. It isn’t actaully logging anywhere and the results aren’t being picked up by other tools (Filebeat–&gt;Logstash–&gt;Elastic&lt;–Kibana).</p>

<h2 id="leverage-the-zeek-logging-framework">Leverage the Zeek Logging Framework</h2>
<p>This script will generate a Zeek log file “udp_packets.log” with the columns: Timestamp, UID, Source IP, SRC Port, Destination IP, Dest Port</p>

<h4 id="script-2-udp_logzeek">Script #2: udp_log.zeek</h4>
<div class="language-plaintext highlighter-rouge"><div class="highlight"><pre class="highlight"><code>module Udplog;

export {
	redef enum Log::ID += { LOG };

	type Info: record {
		ts: time	&amp;log;
		uid: string	&amp;log;
		id: conn_id	&amp;log;
	};
}

event zeek_init(){
	Log::create_stream(Udplog::LOG, [$columns=Info, $path="udp_packets"]);
}

event udp_request(u: connection){
	local rec: Udplog::Info = [$ts=network_time(), $uid=u$uid, $id=u$id];
	Log::write(Udplog::LOG, rec);
}

event udp_reply(u: connection){
	local rec: Udplog::Info = [$ts=network_time(), $uid=u$uid, $id=u$id];
	Log::write(Udplog::LOG, rec);
}

</code></pre></div></div>

<p />
<p>Running this against the same PCAP, Zeek will create a new log file: udp_packets.log. Zeeks standard log file format includes 8 lines of metadata pre-pended and 1 line appended.</p>

<div class="language-plaintext highlighter-rouge"><div class="highlight"><pre class="highlight"><code>wc -l udp_packets.log
510

# NOTE: Subtracting the 9 lines of metadata leave 501 lines of logs.
</code></pre></div></div>

<p />
<p>Using <code class="language-plaintext highlighter-rouge">zeek-cut</code> can clean-up the log for you:</p>
<div class="language-plaintext highlighter-rouge"><div class="highlight"><pre class="highlight"><code>cat udp_packets.log | /opt/zeek/bin/zeek-cut | wc -l
501

^^^ BOOM !
</code></pre></div></div>
<p />
<p>You do not need to run both of these scripts together at the same time. The first script was a proof of concept and prints to STDOUT while the second is a more permanent script to be used during live capture and when ingesting your logs into other tools. You can also send output as JSON if needed.</p>

<p>Thanks for reading.</p>]]></content><author><name></name></author><category term="zeek" /><category term="scripts" /><category term="pcap" /><summary type="html"><![CDATA[I wrote my first two Zeek scripts to solve a simple problem of logging every UDP packet.]]></summary></entry><entry><title type="html">Install EVE-NG in Google Cloud (2021 Edition)</title><link href="https://blog.showipintbri.com/blog/eve-ng-in-gcp" rel="alternate" type="text/html" title="Install EVE-NG in Google Cloud (2021 Edition)" /><published>2021-02-28T00:00:00-06:00</published><updated>2021-02-28T00:00:00-06:00</updated><id>https://blog.showipintbri.com/blog/eve-ng-in-gcp</id><content type="html" xml:base="https://blog.showipintbri.com/blog/eve-ng-in-gcp"><![CDATA[<p>This is an update from the content I released back in 2018. Thanks to the EVE-NG development team this process can be completed in just 15 minutes. I released a video series on Network Collective covering this topic and other EVE-NG Tips and Tricks.</p>

<h4 id="process-summary">Process Summary</h4>
<ol>
  <li>Login to Google Cloud using your existing Google account or create a new account</li>
  <li>Create a new project</li>
  <li>Create the nested virtualization Ubuntu VM image</li>
  <li>Create a new VM instance using the new image</li>
  <li>Run the installation script</li>
  <li>Run the setup wizard</li>
</ol>

<center><iframe width="560" height="315" src="https://www.youtube.com/embed/sMYtz-bSZLQ" frameborder="0" allow="accelerometer; autoplay; encrypted-media; gyroscope; picture-in-picture" allowfullscreen=""></iframe></center>

<h2 id="1-log-in-to-google-cloud">1. Log In To Google Cloud</h2>
<p>You can use your existing Google or Gmail account or create a new account for google cloud. <a href="https://cloud.google.com">https://cloud.google.com</a>
If this is your first time Google will give you a $300 free credit. This is more than enough to test this process and practice a bunch of labs.</p>

<h2 id="2-create-a-new-project">2. Create A New Project</h2>

<h2 id="3-create-the-new-vm-image">3. Create The New VM Image</h2>
<p>Navigate to: <strong>Compute Engine –&gt; VM instances</strong> and switch to your new Project from the upper left hand drop down.</p>

<p><strong>NOTE:</strong> This takes a few minutes.</p>

<p>Once the Compute Engine is ready, click on the <strong>“Launch Cloud Shell”</strong> icon (in the upper right).</p>

<p>Make sure your Cloud Shell session is set to your newly created project. (It should have your project name in the command prompt.)</p>

<p>Enter the command: (this is 1 long command)</p>
<div class="language-plaintext highlighter-rouge"><div class="highlight"><pre class="highlight"><code>gcloud compute images create nested-virt-ubuntu --source-image-project=ubuntu-os-cloud --source-image-family=ubuntu-1604-lts --licenses="https://www.google.com/compute/v1/projects/vm-options/global/licenses/enable-vmx"
</code></pre></div></div>
<p><strong>NOTE:</strong> It could take a few minutes to return to an interactive prompt. Be patient.
You are ready when the shell returns “STATUS READY”:</p>
<div class="language-plaintext highlighter-rouge"><div class="highlight"><pre class="highlight"><code>user@cloudshell:~ (test-305418)$ gcloud compute images create nested-virt-ubuntu --source-image-project=ubuntu-os-cloud --source-image-family=ubuntu-1604-lts --licenses="https://www.google.com/compute/v1/projects/vm-options/global/li
censes/enable-vmx"
Created [https://www.googleapis.com/compute/v1/projects/test-305418/global/images/nested-virt-ubuntu].
NAME                PROJECT      FAMILY  DEPRECATED  STATUS
nested-virt-ubuntu  test-305418                      READY
user@cloudshell:~ (test-305418)$
</code></pre></div></div>
<p>Now, close the Cloud Shell terminal.</p>

<h2 id="4-create-the-new-vm-instace">4. Create The New VM instace</h2>
<p>Click on the “Create” button in the VM instances frame in the center of the screen.</p>

<ul>
  <li><strong>Name:</strong> Anything you want (cannot change)</li>
  <li><strong>Labels:</strong> (optional)</li>
  <li><strong>Region:</strong> Choose the region nearest you (cannot change)</li>
  <li><strong>Zone:</strong> (cannot change)</li>
  <li><strong>Machine Family:</strong> General Purpose</li>
  <li><strong>Series:</strong> Must choose “Intel Cascade Lake” or “Intel Skylake”</li>
  <li><strong>Machine Type:</strong> This is going to depend on what you need for labbing. You cannot change this unless you power-off your VM. Just to get started I choose “n2-standard-4”.</li>
  <li><strong>Confidential VM service:</strong> Unchecked</li>
  <li><strong>Container:</strong> Unchecked</li>
  <li><strong>Boot Disk:</strong> Choose the image we created from the cloud shell.
    <ul>
      <li>It will be under <strong>“Custom images”</strong>:</li>
      <li>Show images from: <strong><em>Your new project name</em></strong>
        <ul>
          <li><strong>Image:</strong> the image name we created earlier</li>
          <li><strong>Boot Disk Type:</strong> SSD</li>
          <li><strong>Size:</strong> This is going to be determined by you on how you intend to use the VM for labbing. To get started I select 50GB.</li>
        </ul>
      </li>
    </ul>
  </li>
  <li><strong>Identity and API access:</strong> leave default</li>
  <li><strong>Firewall:</strong> Choose “Allow HTTP traffic”</li>
</ul>

<p>Click <strong>“Create”</strong> at the bottom.</p>

<p>Wait for your VM to be provisioned, this could a  minute or two.</p>

<h2 id="5-run-the-installation-script">5. Run The Installation Script</h2>
<p>Once your VM is provisioned it will automatically be started. Use the built-in SSH feature to connect to the VM’s console.</p>

<p>Once you’re SSH’d into the VM become root, grab the installation script, update the package manager and upgrade current packages.</p>
<div class="language-plaintext highlighter-rouge"><div class="highlight"><pre class="highlight"><code>sudo -i

wget -O - http://www.eve-ng.net/repo/install-eve.sh | bash -i

apt update

apt upgrade
</code></pre></div></div>
<p>Reboot the VM.</p>

<h2 id="6-run-the-setup-wizard">6. Run The Setup Wizard</h2>
<p>Connect to it again via the built in SSH.</p>

<p>You will be presented with a configuration wizard.</p>

<h1 id="stop">STOP!</h1>

<p>When you are greeted with the wizard to enter a root password, <strong>don’t!</strong></p>

<p>Hold <strong><code class="language-plaintext highlighter-rouge">CTRL</code></strong> and press <strong><code class="language-plaintext highlighter-rouge">C</code></strong>, become root <strong><code class="language-plaintext highlighter-rouge">sudo -i</code></strong></p>

<p>This will restart the wizard and allow you to change root’s password.</p>

<p>Follow the initial configuration wizard.</p>

<ul>
  <li><strong>Enter Root Password:</strong></li>
  <li><strong>Enter Root Password Again:</strong></li>
  <li><strong>Hostname:</strong> anything you want (I leave default)</li>
  <li><strong>DNS Domain Name:</strong> anything you want (I leave default)</li>
  <li><strong>DHCP/Static IP:</strong> Choose DHCP/Static</li>
  <li><strong>NTP:</strong> (leave empty)</li>
  <li><strong>Proxy:</strong> Choose “Direct connection”</li>
</ul>

<p>After hitting enter, the setup wizard will kick you out.</p>

<h2 id="7-youre-finished--whats-next">7. You’re Finished / What’s Next?</h2>
<p>At this point the installation is finished. You should have a working EVE-NG server in Google Cloud.</p>

<p>Next, you should:</p>
<ul>
  <li>Start uploading the images you need for labbing</li>
  <li>Start importing your already created labs</li>
  <li>Start thinking securing the ingress and egress traffic of your EVE-NG lab.</li>
  <li>Check out my other blogs and videos for more EVE-NG: Tips &amp; Tricks</li>
</ul>]]></content><author><name></name></author><category term="eve-ng" /><category term="google cloud" /><summary type="html"><![CDATA[This blog outlines the process for installing EVE-NG in Google Cloud in 15 minutes or less. It is the first post to accompany the video series on Network Collective YouTube channel.]]></summary></entry><entry><title type="html">EVE-NG: Internet Access For Your Labs</title><link href="https://blog.showipintbri.com/blog/eve-ng-internet-access" rel="alternate" type="text/html" title="EVE-NG: Internet Access For Your Labs" /><published>2021-02-28T00:00:00-06:00</published><updated>2021-02-28T00:00:00-06:00</updated><id>https://blog.showipintbri.com/blog/eve-ng-internet-access</id><content type="html" xml:base="https://blog.showipintbri.com/blog/eve-ng-internet-access"><![CDATA[<p>This blog outlines one of the questions I’ve been asked the most:</p>
<blockquote>
  <p>How do I give internet access to my running images?</p>
</blockquote>

<p>Ever since I released my video <strong>How to run EVE-NG in Google Cloud</strong> in 2018, I have been inundated with this question and others. I finally put it all together for you and introduce some new ideas in my video series.</p>

<p><strong>Skill Level Required:</strong> Medium</p>

<p>If you already know what to do with these commands then go ahead and get started.</p>

<p>If you don’t know what to do, I created a follow along video, along with other EVE-NG: Tips &amp; Tricks:</p>

<center><iframe width="560" height="315" src="https://www.youtube.com/embed/7CJR2l8VXM0" frameborder="0" allow="accelerometer; autoplay; encrypted-media; gyroscope; picture-in-picture" allowfullscreen=""></iframe></center>

<h2 id="add-an-ip-address-to-the-2nd-bridge-interface">Add an IP address to the 2nd bridge interface:</h2>
<div class="language-plaintext highlighter-rouge"><div class="highlight"><pre class="highlight"><code>sudo -i

root@eve-ng:~# nano /etc/network/interfaces

# This file describes the network interfaces available on your system
# and how to activate them. For more information, see interfaces(5).

# The loopback network interface
auto lo
iface lo inet loopback

# The primary network interface
iface eth0 inet manual
auto pnet0
iface pnet0 inet dhcp
    bridge_ports eth0
    bridge_stp off

# Cloud devices
iface eth1 inet manual
auto pnet1
iface pnet1 inet static     # &lt;-- Change this to static
    bridge_ports eth1
    bridge_stp off
    address 10.199.199.1    # &lt;-- Create an address
    netmask 255.255.255.0   # &lt;-- Create a subnet mask
    
[ ... omitted for brevity ...]
</code></pre></div></div>

<h2 id="restart-networking">Restart Networking:</h2>
<div class="language-plaintext highlighter-rouge"><div class="highlight"><pre class="highlight"><code>root@eve-ng:~# systemctl restart networking
</code></pre></div></div>

<h2 id="turn-on-ipv4-forwarding">Turn on IPv4 Forwarding:</h2>
<div class="language-plaintext highlighter-rouge"><div class="highlight"><pre class="highlight"><code>Edit /etc/sysctl.conf as root and uncomment:

# net.ipv4.ip_forward=1

so that it reads:

net.ipv4.ip_forward=1
</code></pre></div></div>

<h2 id="force-sysctl-to-read-the-new-values-from-the-file">Force <code class="language-plaintext highlighter-rouge">sysctl</code> to read the new values from the file:</h2>
<div class="language-plaintext highlighter-rouge"><div class="highlight"><pre class="highlight"><code>sudo -i
sysctl -p /etc/sysctl.conf
</code></pre></div></div>

<h2 id="configure-iptables-to-nat-outbound-connections">Configure <code class="language-plaintext highlighter-rouge">iptables</code> to NAT outbound connections:</h2>
<div class="language-plaintext highlighter-rouge"><div class="highlight"><pre class="highlight"><code>sudo -i
iptables -t nat -A POSTROUTING -s 10.199.199.0/24 -o pnet0 -j MASQUERADE

# The source "-s ##.###.###.#/##" needs to match the subnet you configured the "pnet1" interface with from above.
</code></pre></div></div>

<h2 id="make-iptables-changes-persistent">Make <code class="language-plaintext highlighter-rouge">iptables</code> changes persistent:</h2>
<p>Save the current iptables rules (including the new rule we just added) and create a new file for our script:</p>
<div class="language-plaintext highlighter-rouge"><div class="highlight"><pre class="highlight"><code>sudo -i
root@eve-ng:~# iptables-save &gt; /etc/iptables.rules
root@eve-ng:~# nano /etc/network/if-pre-up.d/iptables
</code></pre></div></div>

<p><strong>Enter this content:</strong></p>
<div class="language-bash highlighter-rouge"><div class="highlight"><pre class="highlight"><code><span class="c">#!/bin/sh</span>
iptables-restore &lt; /etc/iptables.rules
<span class="nb">exit </span>0
</code></pre></div></div>

<p><strong>Save changes then edit/create next “iptables” file:</strong></p>
<div class="language-plaintext highlighter-rouge"><div class="highlight"><pre class="highlight"><code>root@eve-ng:~# nano /etc/network/if-post-down.d/iptables
</code></pre></div></div>

<p><strong>Enter this content:</strong></p>
<div class="language-bash highlighter-rouge"><div class="highlight"><pre class="highlight"><code><span class="c">#!/bin/sh</span>
iptables-save <span class="nt">-c</span> <span class="o">&gt;</span> /etc/iptables.rules
<span class="k">if</span> <span class="o">[</span> <span class="nt">-f</span> /etc/iptables.rules <span class="o">]</span><span class="p">;</span> <span class="k">then
    </span>iptables-restore &lt; /etc/iptables.rules
<span class="k">fi
</span><span class="nb">exit </span>0
</code></pre></div></div>

<p><strong>Save changes. Make both files executable:</strong></p>
<div class="language-plaintext highlighter-rouge"><div class="highlight"><pre class="highlight"><code>sudo chmod +x /etc/network/if-post-down.d/iptables
sudo chmod +x /etc/network/if-pre-up.d/iptables
</code></pre></div></div>

<h2 id="troubleshooting">Troubleshooting</h2>
<h4 id="the-proper-process">The Proper Process</h4>
<p>I have had great success with this process:</p>
<ol>
  <li>Making the above configuration changes to the VM.</li>
  <li>Adding the <strong>Cloud 1</strong> network to your topology.</li>
  <li>Adding any device images.</li>
  <li>Connecting their MGMT interfaces to Cloud 1.</li>
  <li>Power on the device images.</li>
  <li>Configure their MGMT IP address, subnet mask and Default Gateway.</li>
  <li>Ping the Default Gateway</li>
  <li>Ping an external network (8.8.8.8)</li>
</ol>

<p>Your first test should always verify you can ping your default gateway(pnet1 interface) from your lab images. If you cannot ping your default gateway try these steps:</p>
<ul>
  <li>Shutdown your lab images conencted to <strong>Cloud 1</strong> and restart them. Try to ping the Default GW.</li>
  <li>Delete your <strong>Cloud 1</strong> from your topology, save and exit your topology. Launch your topology again and drop in the <strong>Cloud 1</strong> network again, reconnect it to the device images mgmt interfaces and start the device images.</li>
</ul>]]></content><author><name></name></author><category term="eve-ng" /><category term="google cloud" /><category term="internet access" /><summary type="html"><![CDATA[This post outlines the changes necessary to give images in your lab internet access. This is accompanied by a step-by-step video series released on Network Collective's YouTube channel.]]></summary></entry></feed>