What I learned From Sharkfest '20
I learned a ton of great things that will help me as a better network engineer, and analyst. This will be a recap of a couple important take aways that everyone can use any time they are looking at PCAPs. If you find any of this interesting go subscribe to the Sharkfest YouTube channel and start planning to attend the next Sharkfest near you!
Where You Capture From Matters!
The key take away here is:
- Know what questions you’re trying to answer and which capture points are the best to answer those questions.
- Capture at both sides of the conversation, source & destination, this will give the most complete view.
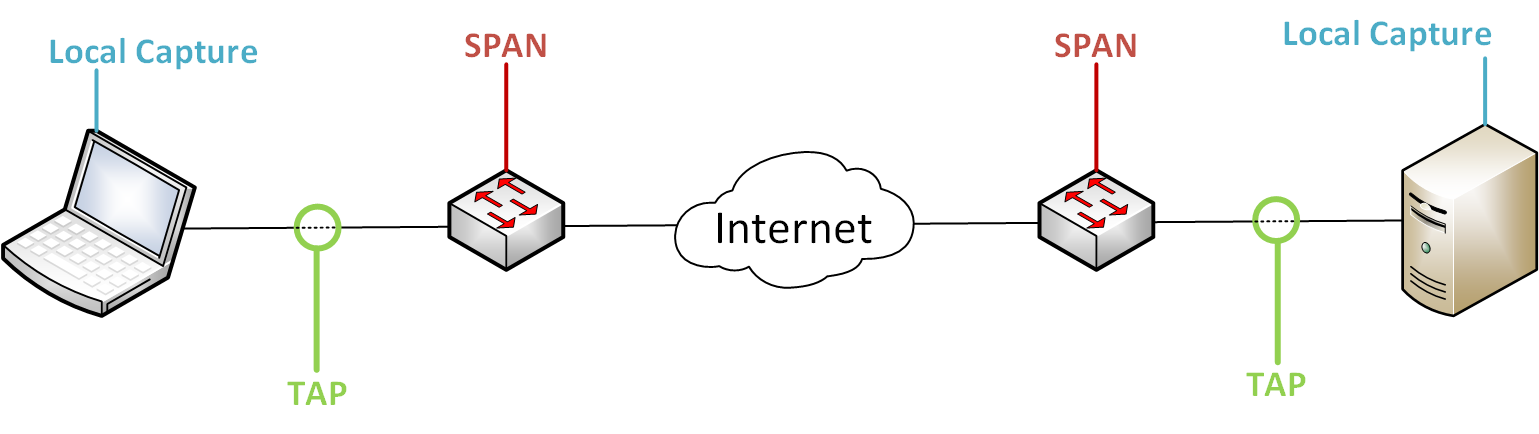
Source/Destination local host capture: (Score: 1/3)
-
 Software change only. (Administrative privileges required)
 -
 Data/timings/performance can be mis-leading.
 -
Hardware offloading (at the NIC) can present misleading PCAPs with regards to: packet tx/rx timings, performance and packet sizes.
TAP near the source/destination: (Score: 3/4)
-
Best option for measuring tx/rx timings.
-
True on-the-wire sizing.
-
Great for measuing performance.
-
Requires physical network changes.
SPAN/Mirror: (Score: 1/5)
-
Can capture many clients/servers at once.
-
Not ideal for measuring performance.
-
Each vendor can pull the SPAN/Mirror from differnt packet/frame hardware/software paths resulting in differnt headers being stripped or added before or after being SPAN/Mirrored.
-
Packets can be lost/not SPAN’d resulting in broken sessions in the PCAP.
-
Packets can be queued for tx changing the original rx timing.
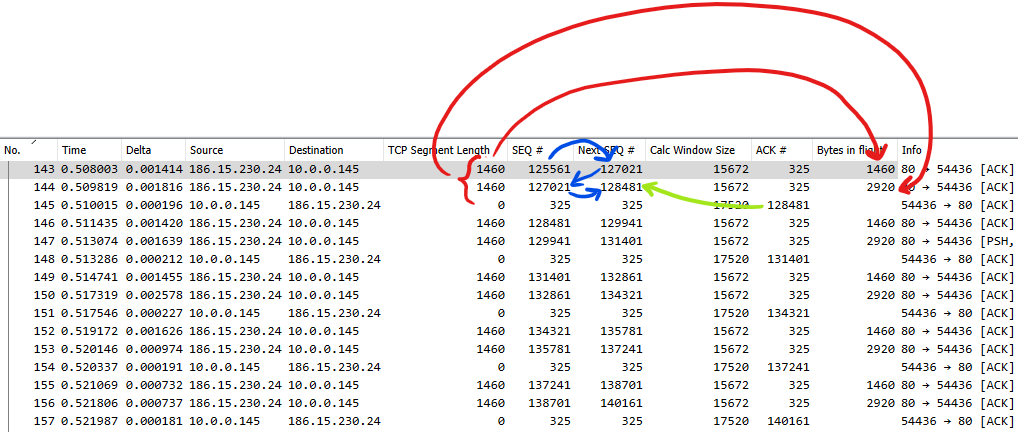
IP ID Number
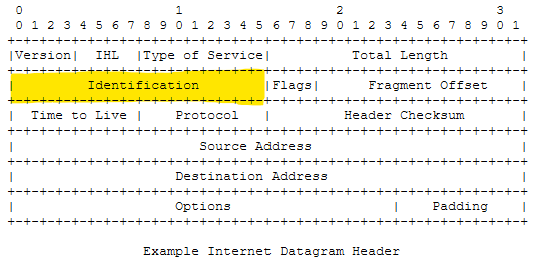
From RFC 791:
   Identification:  16 bits

   An identifying value assigned by the sender to aid in assembling the
   fragments of a datagram.
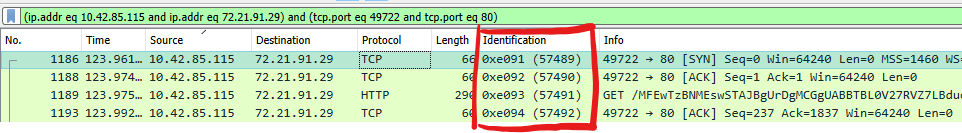
The IP ID is set by the sender for when a packet is fragmented in the path it indicates to the receiver that all the fragments should be reassembled and are part of the same packet. Both the client and server set their own IP ID values.
The very convienient thing about IP ID is, they are often sequential making it super easy to spot: out of order packets, missing packets, and hardware offloading in some cases. If you were to follow an IP conversation and filter by only the source or destination, you would commonly see sequential IP ID’s.
This is a mandatory field in IPv4 for all IP packets but is only seen in IPv6 packets when fragmentation is used.
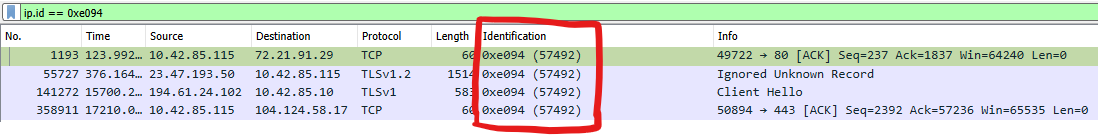
Warning: It is possible to have the same IP ID for different sessions within the same PCAP.
Like everyhting in IT and networking, there’s always exceptions, as was pointed out in Sharkfest Discord by Jasper:
Some Firewalls can change the IP ID, e.g. pfSense has a “IP Random id generation” setting which modifies the IP ID.

IP ID can also reveal if a TCP Retransmission is a true retransmission or if it is a packet that was captured twice. If a packet was captured twice, or if duplicate packets were created by a networking device in the path, the IP ID would be the same on both captured packets. If the captured packet is a true TCP Retransmission a new IP ID would be used (in most cases).
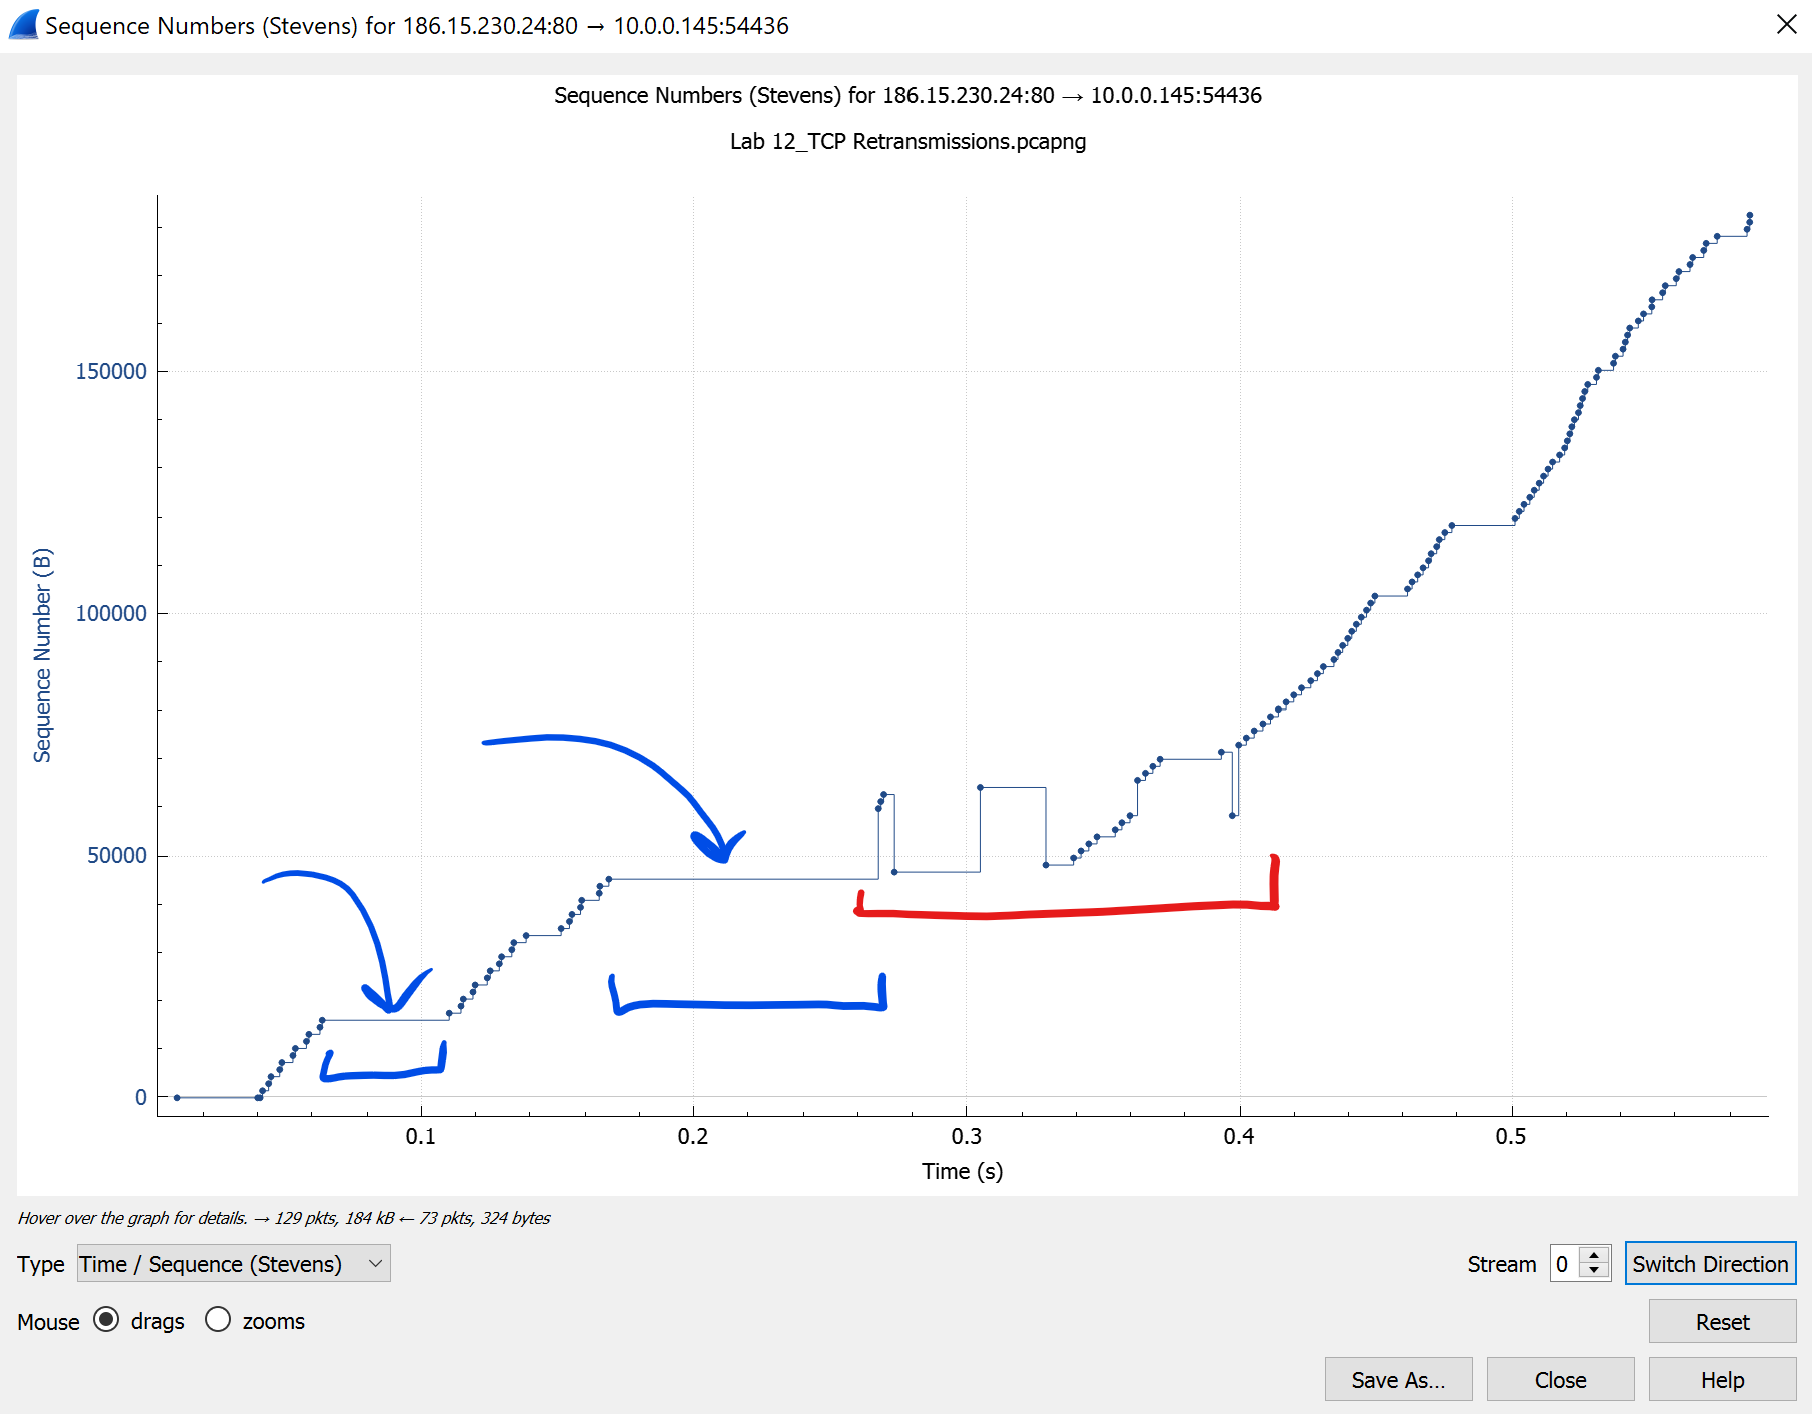
TCP Stream Graphs
This is a feature in Wireshark I have never used in confidence. I knew it existed but didn’t understand: what I was looking at and what these graphs could indicate.
Through some careful hand holding I now have a basic understanding of them and I now incorporate them into my analysis, when needed.
These can all be found under: Statistics –> TCP Stream Graphs
Stevens Graph: Tracks sequence numbers seen over time. This is uni-derectional. This can indicate so quickly when out-of-order packets have been seen.
-
Ideally you would want a constant incline.
-
When you see valley’s or falls it indicates a packet was received with a sequence number lower than the packets before it.
-
When you see a plateau it indicates time has passed without seeing an increase of sequence number.
- NOTE:
- These indicators by themselves aren’t always an issue but can start to build a story of where an issue might be.
-
The Power of Profiles
I have never used different profiles for different scenarios. I always stuck with the “Default” profile. Through Sharkfest I learned the importance of different profiles and how they contribute to the efficiency of analysis.
Depending on what type of questions you need to answer you might need different data available to you (different from the default profile). This is why profiles are so important.
Some of the things you can do with profiles are:
- Coloring Rules: Define when Wireshark should highlight a packet and what the foreground/background colors should be.
- Columns: You can customize colomns putting the data you need next to each other.
- Filter Buttons: Buttons which store common display filters so the can be easily applied.
While the below TCP Profile might not mean anything to you. That’s okay because it’s not suposed to mean anything to you, it’s supposed to mean something to me and help me solve a problem. Profiles are very personal and should help the individual increase their own analysis efficiency.
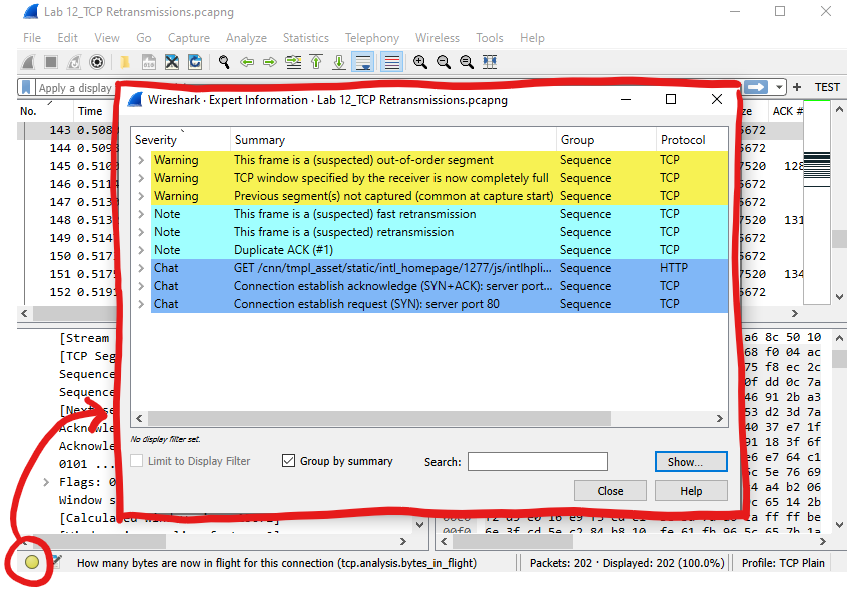
Expert Information
Shamefully, I never knew what that “stop light” indicator was for in Wireshark’s bottom left corner. From Sharkfest, I learned that is an aggregate of the “Expert Information” Wireshark sometimes adds to packets to indicate something that should be looked at. It’s important to know that these aren’t all “problems”, this is just information. Some of the quick things this is good for is quickly locating packets where: TCP Window is Full, Out-of-Order segments TCP Retransmissions and more.
The color of the stop light will be of the highest severity seen in the capture.
…But Wait, There’s More!
I learned sooo much and there’s so much more detail and depth to go into on each of these topics.
There are many more analysis eficiencies to go over.
If you want to learn more or if I got something wrong, let me know using Disqus below (you can post as guest), or let me know on Twitter ![]()
Again, if you find any of this interesting go subscribe to the Sharkfest YouTube channel and start planning on attending the next Sharkfest near you!